Download
1 / 23
240 likes | 266 Views
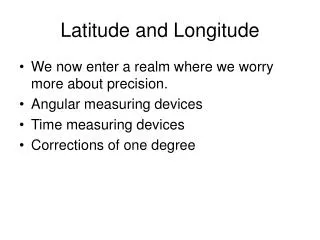
Topographic & Geologic Maps Plus: Latitude and Longitude!. Objectives. Distinguish between latitude and longitude and Explain how each may be used to locate places on Earth’s surface. Explain how a magnetic compass can be used to find directions on Earth’s surface.

E N D
Objectives • Distinguish between latitude and longitude and Explain how each may be used to locate places on Earth’s surface. • Explain how a magnetic compass can be used to find directions on Earth’s surface. • Describe the characteristics and uses of three types of map projections. • Summarize how to use keys, legends, and scales to read maps.
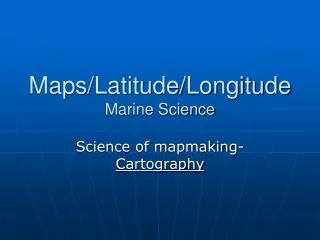
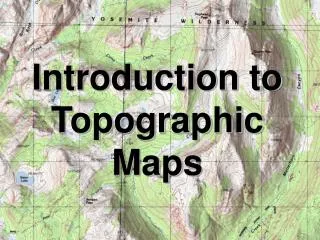
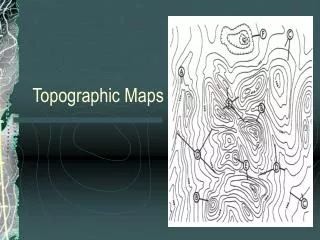
Maps - Introduction Maps show us different things. Road Map – Shows us how to get from one place to another. Shaded Relief MapShows us the shape of the land – mountains, valleys, rivers and lakes. Topographic Map Uses contour lines to show elevation.
Topographic Maps - Introduction • Topography: shape of the land and surface features. • Elevation: height of an object above sea level • Topographic Map: Shows the shape of the land with contour lines: lines which connect points of equal elevation
Topographic Maps - Contour • Contour interval: difference in elevation between one contour line and the next • Index Contours: The heavier, wider contour line (usually every 5th line) used to make the contour map easier to read
Map Reading Activity: Topography Q: What is the contour interval for the map? 40 feet Q: What is the distance between each index contour? 200 feet
Topographic Map – Contour Properties • Closely spaced contour lines represent steep slopes • Widely spaced contour lines represent gentle slopes
Topographic Map – Contour Properties Q: Approximately how tall is Able Hill? About 42m Q: Approximately how tall is Baker Hill? About 50m Q: Which hill is taller and by how much? Baker Hill, 8m Q: How many meters of elevation are there between contour lines? 10m Q: Are the contour lines closer together at Able Hill or Baker Hill? Baker Hill Q: Which mountain has steeper slopes? Baker Hill
Topographic Map – Contour Properties • A contour line which bends to form a V shape indicates a valley. The bend points toward the higher end of the valley • This V also points upstream, or in the direction from which the water flows, if there is a stream. • Contour lines which form closed loops indicate a hilltop or a depression Closed loops with short straight lines perpendicular to the inside of the loop indicate a depression or basin
Topographic Map - scale • Map scales: express the relationship between the distance shown on a map and the actual distance • Usually represented as a ratio (1:24,000) or a fraction (1/24,000) • 1:24,000 means 1 unit on the map represents 24,000 of the same units of the earth 1:250,000 Covers more area but in less detail. Note The town of Apollo (center) and the Kiskiminetas River. 1:100,000 Medium scaled map. Note the town of Apollo. You can see the streets and the Kiskiminetas in more detail. 1:24,000 The small scale shows the most detail. It covers less area but with much more detail. Note Apollo. You can see houses and buildings.
Topographic Map – Symbols & Colors • Symbols: used to show features on topographic maps • Legend: list of map symbols and their meanings • Blue – water features • Green – woodlands • Brown– contour lines • Red – roads, urban areas • Black – Man-made feature
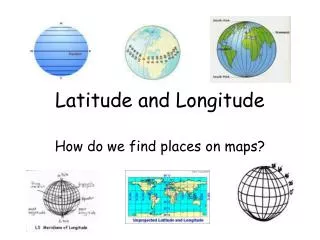
Typical maps show north at the top, east at the right, west at the left, and south at the bottom. Many maps also include a compass rose, which indicates the directions, or an arrow which points north. Some maps use latitude and longitude to indicate direction and location. Direction
The equator divides Earth into Northern and Southern Hemispheres Latitude: a geographic coordinate (measured in degrees), which specifies the east-west position of a point on Earth's surface The equator is located at 0° latitude. The North Pole and South Pole are located at 90°N and 90°S 1° = 111 km = about 69 miles Latitude
Latitude is measured and from the South North Equator
180 150 120 90 60 30 0 30 60 90 120 150 180 165 135 105 75 45 15 15 45 75 105 135 165 90 80 70 E 60 50 40 30 F 20 10 0 10 G 20 30 40 50 60 H 70 80 90 North South
Longitude: a geographic coordinate which specifies the east-west position of a point on the Earth's surface Another name for a line of longitude is a meridian, and the prime meridian is the line of longitude at 0° which separates East and West Hemispheres Longitude
Longitude is measured and from the West East Prime Meridian
180 150 120 90 60 30 0 30 60 90 120 150 180 165 135 105 75 45 15 15 45 75 105 135 165 90 80 70 E 60 50 40 30 F 20 10 0 10 G 20 30 40 50 60 H 70 80 90 East West
Latitude and Longitude Lines We put latitude and longitude together to find locations • Example: Milwaukee, Wisconsin • Use latitude to find how far north or south. • Use longitude to find how far west or east. 44°N, 90°W Latitude is always first Mr. Fetch's Earth Science Class A+
180 150 120 90 60 30 0 30 60 90 120 150 180 165 135 105 75 45 15 15 45 75 105 135 165 90 80 70 E 60 50 40 30 F 20 10 0 10 G 20 30 40 50 60 H 70 80 90 On the coordinate system, plot the coordinates given in your notes: D A B C
180 150 120 90 60 30 0 30 60 90 120 150 180 165 135 105 75 45 15 15 45 75 105 135 165 90 80 70 E 60 50 40 30 F 20 10 0 G 10 20 30 40 50 60 H 70 80 90 State the coordinates for each of the letters in the figure above: 20°N, 75°E 65°N, 50°W 70°S, 15°E 10°S, 135°W
Geologic maps show geologic features, such as types of rocks in a given area, and locations of faults, folds, and other features Geologic features are separated by color Other markings on geologic maps are contact lines: indicates places at which two geologic features meet The main types of contacts are faults Geologic Maps