Download
1 / 30
310 likes | 369 Views
This resource provides a comprehensive overview of functional MRI (fMRI) analysis, covering key concepts such as pre-processing, individual subject analysis, group analysis, connectivity, and more. It delves into the goals of fMRI analyses for both task-based and resting-state experiments, explaining the conceptual basis behind time shifting, despiking, image registration, masking, scaling, and more. It also explores time series regression, spatial normalization, group analyses, and different data formats in fMRI analysis. With a focus on understanding and checking each step applied to the data, this guide emphasizes the importance of thoughtful analysis and provides insights into various modeling techniques.

E N D
Functional MRI Analysiswith AFNI accents Robert WCox robertcox@mail.nih.gov July 2017
To Dream the Impossible Dream • i.e., To explain FMRI Analysis in 60 min • Basis for FMRI time series analysis: • 10-20 inter-twined concepts • pre-processing ; individual subject analysis ; group analysis ; connectivity ;… • Many seem simple, but each one has subtleties and points of contention • Can only cover the most central ideas now • Absolute Beginners: Confusion Ahead!
Some Goals of FMRI Analyses • Task-based experiments • Per subject: estimate amplitude of BOLD response to each different type of stimulus • Model+Estimate inter-regional correlations between fluctuations in BOLD responses • Resting-state experiments • Measure spatial patterns in coherent fluctuations in spontaneous BOLD effects • Group level • Combine and contrast per subject results
pre-processing Conceptual Basis - 1 • Time shifting= pretend get 3D snapshot • Despiking= remove large blips • Image Registration(AKA alignment) • intra-EPI time series, and EPI-Structural • Blurring in space= lower resolution :-( & less noise :-)& more group overlap :-) • Masking= ignore non-brain voxels • Scaling=normalizing data amplitude • Makes inter-subject comparisons more valid
Conceptual Basis - 2 • Time series regression • model of the BOLD response in the data =Hemodynamic Response Function convolved with stimulus timing • plus baseline (null hypothesis) model • plus physiological noise • plus allow for serial correlation • plus allow for random response strength (!!) • Talairach-ing= Spatial Normalization • Talairach, MNI-152, … • affine and nonlinear spatial transformations
Conceptual Basis - 3 • Group Analyses= Putting it all together • ANOVA, LME, MVM, Meta-Analyses, … • Blobs= Spatial models of activation • Assigning statistical significance to blobs • Connectivity= Inter-regional analyses • SEM, PPI, SVAR, DCM, … • Resting state FMRI (Connectome!) • Dimensional factorization • Components, such as PCA, ICA, …
Conceptual Basis - 4 • Data Formats= NIfTI-1.x is your friend • Software for FMRI analyses: • AFNI*, BrainVoyager, FSL*, SPM*, … • Whichever you use, don't blindly assume the software works perfectly all the time • Most important thing I will say today Understand and check the steps applied to your data! • 2nd most important: Is no "best" way to analyze data, just "reasonable"ways *open-source
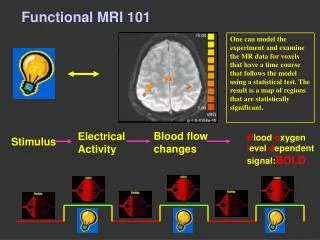
Time Series Regression • After pre-processing the images: • Each voxel time series is (separately) fit to an idealized model of the BOLD effect • Plus other (nuisance) components • Baseline drift, physiological artifacts, … • Estimated parameters of the BOLD model are the "activation map" • Amplitude of response = most common • Shape of response can also be modeled • Statistics on parameters allow thresholding
Basic BOLD Model • Assumptions: • BOLD response starts ≈ 2s after "activity" • Rises to peak about ≈ 4s later • Drops to baseline about ≈ 5s post-activity • Overlapping (in time) BOLD responses from separate events add up =linearity
Further Model Pieces-Parts • FMRI data = pretty noisy • Need multiple copies of each stimulus type • Assume BOLD responses same within type • Slow drifting terms in baseline • Residual effects of subject movements • Use motion parameters as extra regressors • Include physiological regressors (RetroICOR) • From monitoring heartbeat & respiration • Serial correlation in noise use GLSQ highpass filter
Sample Linear Regression Model Motion Params BOLD + Stimuli Models Slow Drift Model
One Voxel's Time Series • This is good data at a high signal voxel • 2 stimulus classes; 1 block every 30s; TR=2s Black = 150 data points Red = fitted model (BOLD++) Data: Mike Beauchamp/UTexas
Results from One Subject ShowThru rendering of difference between visual and auditory BOLD amplitudes
Talairach-ing(AKA Normalizing) • For combining and contrasting results across groups of subjects • Align 3D brain images (usually structural volumes) to a common template • Assumption: function follows structure • Then merge results on a voxel-wise basis on this new grid • Accuracy of alignment = 5-10 mm • Spatial blurring = more inter-subject overlap
FCON-1000 (affine) Templates • Ye Good Olde Days =Talairach-Tournoux atlas • Decadent modern times =MNI-152 template = average of 152 brain images 1.5T 3.0T 3.0T MNI-152 (affine) FCON-1000 (poly9)
Custom Templates • Can register all subjects in study together iteratively • Then average to get a study-specific template • Can use high order nonlinear spatial warps for better structural feature alignment 3.0T 101 subjects AFNI3dQwarp Data: MindBoggle • Alternatives: • ROI or Atlas-based analyses • Cortical surface-based analyses [cf. SUMA]
Group Analysis • Group analysis is done in 2 stages: • Individual subject analyses reduce EPI time series to BOLD response parameters • Inter-subject analysis is done on these parameters (e.g., measures of amplitude) • Usually have some estimate of reliability of these parameters (e.g., standard deviation) • Normalization of data magnitude and spatial normalization are important steps
Flavors of Group Analysis - 1 • t-tests for simple 2-way contrasts • ANOVA of various complexities for more intricate collective effects • Usually end up wanting to do t-tests on these "main" effects to see What's Up (Doc) • Plain ANOVA relies on many assumptions about distribution of randomness • Independent noise (or all samples are correlated the same way; "sphericity") ; Gaussianity ;Homoscedasticity (all samples have same variance) ; Balanced designs
Flavors of Group Analysis - 2 • Linear Mixed Effects (LME) and Multi-Variate Models (MVM) generalize ANOVA to avoid such assumptions • Meta-Analysis: Statistics run on statistics • Which is exactly what we are doing in FMRI • Many developments in the 1990s • Can be applied to FMRI data, using not just the individual subject amplitudes, but also their reliability estimates;cf. AFNI and FSL • Can also model non-Gaussianity (outliers)
Meta-Analysis Results Meta-Analysis Task A: 20 sub Task B: 12 sub Task C: 11 sub ANOVA Yellow = Stronger Data: James Bjork/NIH
Blobs! [AKA Clusters] • For most purposes, if we saw that all the statistically significant activation was just in tiny and scattered clusters, we would be suspicious and upset • We not only threshold on voxel-wise t- or F-statistics, but we also threshold on size of contiguous supra-threshold clusters • Allows us to lower the per-voxel threshold by raising the cluster-size threshold to maintain error rate control
Blob Significance (!!) • Probability that a smooth noise-only image would produce a blob, with each voxel above a given threshold and the size of the blob above a given cutoff • Cannot be calculated in closed form :-( • Two approaches available: • Asymptotic formula for high per-voxel thresholds and high degrees of smoothness • Direct Monte-Carlo simulation (brute force) • Which to use? Depends on your software! K Worsley AFNI
Connectivity • FMRI basis: Fluctuations in neural activity fluctuations in BOLD signal • Task performance changes between repetitions can give coherent signal changes in remote brain regions • Can look for causal changes also: • e.g., Predictability of one region's data from another's data at a previoustime step • Limited TR of FMRI data makes this iffy • Probably need TR < 1s to do this well
Task-Based Connectivity • Fluctuations from model fit can be bigger than noise; recall this graph from 1 voxel • So can subtract the fit and then look for inter-voxel correlations (if have enough data)
Flavors of Connectivity - 1 • Simple correlation from a seed region (or voxel) with all other voxels in brain • Ambitiously: Correlate All-with-All :-) • Then group analysis for statistical power • Used in resting-state FMRI analyses +0.4 -0.4 RS-FMRI: 15 subjects Data: Alex Martin/NIH
Flavors of Connectivity - 2 • PPI =Psycho-Physiological Interaction • We call it "Context Dependent Correlation" • Augment the regression model with data time series averaged from a seed region • And multiplied by +1 in context A, -1 in context B, and 0 in other cases (e.g., baseline) • Fit parameter for new regressor measures fluctuations in EPI signal whose correlation with seed region changes between contexts (A&B) • Context = "Psycho" ; EPI/BOLD = "Physio"
Flavors of Connectivity - 3 • Network models use multiple regions, try to fit multiple dependencies amongst them • FMRI noise means must average over pre-chosen regions before network hunting+fitting • Anatomical ROIs or Functional ROIs? • Instantaneous directional effects: • Structural Equation Modeling (SEM) • Delayed (causal) effects: • Dynamic Causal Modeling (DCM) • Structural Vector AutoRegression (SVAR)
Connectivity Conclusions • Often: make statement about changes in connectivity between two situations • Absolute connectivity statements are somewhat less common (though not rare) • When contrasting subject groups, must be careful that physiological differences (e.g., respiration) are accounted for • Especially in resting-state studies, which don't have any task-timing to which we can tie down the analysis
Final Gratuitous Remarks • Multi-stimulus linear regression models for task-based FMRI appear in mid-1990s • Since then, most task-based FMRI time series analysis improvements have been incremental and/or controversial and/or of limited scope —IMHO • Are we near the limit of what kind of information can be gleaned from current-technology FMRI datasets? • Or do we just need to be cleverer?
Th'Th'That's All Folks! • Thanks must go to • Ziad Saad, Gang Chen, Rick Reynolds, Daniel Glen, Paul Taylor • James Hyde, Peter Bandettini, Andrzej Jesmanowicz • Elliot Stein, Jeff Binder, Steve Rao, Alex Martin, Leslie Ungerleider, Ted Deyoe, …and too many more brain-ologists to name herein Data: Warner Bros.