Download

1 / 10
100 likes | 150 Views
Probit regression offers a unique approach to dichotomous response interpretation in psychology. Learn how to analyze and interpret results using the Probit Model. Explore examples with GRE scores and admission status. Compare Probit vs. Logit modeling methods for insightful data analysis.

E N D
Probit Regression Psych 818 - DeShon
Dichotomous Response • Probit regression is based on a different approach to the dichotomous response process • Assume that the right model is: • Y = bo + b1(X) + e • where e is a normally distributed error and Y is a continuous outcome • Y is latent and instead we observe a dichotomous response • Views dichotomous response as a coarse measurement issue
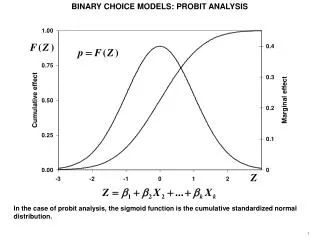
Dichotomous Responses • Observe Y=1; if Y > c • Observe Y=0; if Y < c • Use the normal distribution to determine the probability of a 1
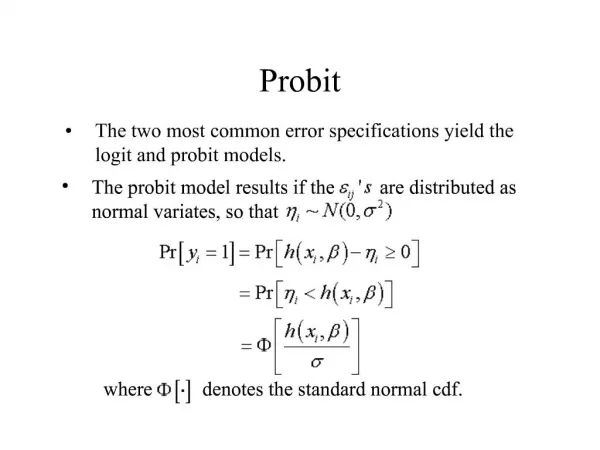
Probit Model • The cumulative distribution function (cdf) is the integral of the pdf from −∞ to a point of interest • This gives the probability of obtaining a value less than (or equal to) X. • For the normal this is
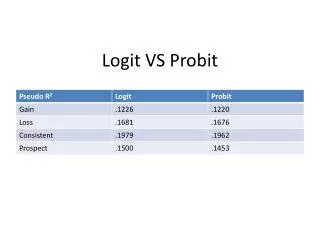
Probit vs. Logit • logit = 1.7 probit • x <- seq(-5,5,.01) • x2 <- 1.7*x • # Adjust for different Logit scale • Px <- pnorm(x) • Lx <- 1/(1+exp(-x)) • Lxs <- 1/(1+exp(-x2)) • plot()
Analysis Example • GRE and grad school admissions • 400 students with GRE scores and admission status
Analysis Example • Logit Model • lr <- glm(ADMIT~GRE, family=binomial, data=df) • exp(lr$coefficients) • But GRE scores increment by 10, not 1 so.. • 1.0035886^10=1.036471 • 1 unit change in GRE increases odds of admissions by a factor of 1.03 Coefficients: (Intercept) GRE -2.901344 0.003582 (Intercept) GRE 0.0549493 1.0035886
Analysis Example • Logit model • Can use predicted probabilities to interpret the results • newdata1<-data.frame(GRE<-seq(220,800,10)) • newdata1$prob<-predict(lr,newdata=newdata1,type="response")
Analysis Example • Probit Model • pt<- glm(ADMIT ~ GRE, family=binomial(link="probit"), data=df) • Notice that the coefficients in the probit model are roughly 1.7 times the coefficients in the logit model Coefficients: (Intercept) GRE -1.768186 0.002175
Probit Results • Can be hard to interpret the coefficients from a probit model so predicted probabilities are commonly computed • newdata1$probpr <-predict(pr,newdata=newdata1,type="response")