Download

1 / 48
480 likes | 487 Views
Explore the complex intertwining of politics and healthcare in America, highlighting the need for reform and personal accountability in the face of rising costs and preventable illnesses.

E N D
has health care ever been so political? • America’s health care system is no stranger to politics • Since WWII, health care policy in America has been inherently political • There’s no reason to think an election will de-politicize the politics of health care, certainly not when tax dollars are funding half of all health expenditures
The Affordable Care Act is not the source of reform…it’s the product of a market demanding change. Repeal it, and the pressure to change will not dissipate. It’s the market, stupid.
change is inevitable • Every system is perfectly designed to get the results it gets. • Paul Batalden • Americans want three things from their health care system, and those are what it has been built to deliver. • Only remaining question: who will redesign it?
Epictetus was right “First say to yourself what you would be; then do what you have to do.”
first we have to re-frame the discussion • We have our problems, and we’re working on them. • But the increasing cost of health care can’t be laid entirely at our doorstep. • We’re focused on preventable harm; but what about preventable illness? • It’s time for America to address personal accountability.
personal freedom has a price tag • Smoking is the single most preventable cause of disease, disability, and death in the United States. • Each year, an estimated 443,000 people die prematurely, and another 8.6 million live with a serious illness caused by smoking. • Economic burden of tobacco use: more than $96 billion a year in medical costs.
Obesity Trends* Among U.S. AdultsBRFSS, 1990 (*BMI ≥30, or ~ 30 lbs. overweight for 5’ 4” person) No Data <10% 10%–14%
Obesity Trends* Among U.S. AdultsBRFSS, 1985 (*BMI ≥30, or ~ 30 lbs. overweight for 5’ 4” person) No Data <10% 10%–14%
Obesity Trends* Among U.S. AdultsBRFSS, 1986 (*BMI ≥30, or ~ 30 lbs. overweight for 5’ 4” person) No Data <10% 10%–14%
Obesity Trends* Among U.S. AdultsBRFSS, 1987 (*BMI ≥30, or ~ 30 lbs. overweight for 5’ 4” person) No Data <10% 10%–14%
Obesity Trends* Among U.S. AdultsBRFSS, 1988 (*BMI ≥30, or ~ 30 lbs. overweight for 5’ 4” person) No Data <10% 10%–14%
Obesity Trends* Among U.S. AdultsBRFSS, 1989 (*BMI ≥30, or ~ 30 lbs. overweight for 5’ 4” person) No Data <10% 10%–14%
Obesity Trends* Among U.S. AdultsBRFSS, 1991 (*BMI ≥30, or ~ 30 lbs. overweight for 5’ 4” person) No Data <10% 10%–14% 15%–19%
Obesity Trends* Among U.S. AdultsBRFSS, 1992 (*BMI ≥30, or ~ 30 lbs. overweight for 5’ 4” person) No Data <10% 10%–14% 15%–19%
Obesity Trends* Among U.S. AdultsBRFSS, 1993 (*BMI ≥30, or ~ 30 lbs. overweight for 5’ 4” person) No Data <10% 10%–14% 15%–19%
Obesity Trends* Among U.S. AdultsBRFSS, 1994 (*BMI ≥30, or ~ 30 lbs. overweight for 5’ 4” person) No Data <10% 10%–14% 15%–19%
Obesity Trends* Among U.S. AdultsBRFSS, 1995 (*BMI ≥30, or ~ 30 lbs. overweight for 5’ 4” person) No Data <10% 10%–14% 15%–19%
Obesity Trends* Among U.S. AdultsBRFSS, 1996 (*BMI ≥30, or ~ 30 lbs. overweight for 5’ 4” person) No Data <10% 10%–14% 15%–19%
Obesity Trends* Among U.S. AdultsBRFSS, 1997 (*BMI ≥30, or ~ 30 lbs. overweight for 5’ 4” person) No Data <10% 10%–14% 15%–19% ≥20%
Obesity Trends* Among U.S. AdultsBRFSS, 1998 (*BMI ≥30, or ~ 30 lbs. overweight for 5’ 4” person) No Data <10% 10%–14% 15%–19% ≥20%
Obesity Trends* Among U.S. AdultsBRFSS, 1999 (*BMI ≥30, or ~ 30 lbs. overweight for 5’ 4” person) No Data <10% 10%–14% 15%–19% ≥20%
Obesity Trends* Among U.S. AdultsBRFSS, 2000 (*BMI ≥30, or ~ 30 lbs. overweight for 5’ 4” person) No Data <10% 10%–14% 15%–19% ≥20%
Obesity Trends* Among U.S. AdultsBRFSS, 2001 (*BMI ≥30, or ~ 30 lbs. overweight for 5’ 4” person) No Data <10% 10%–14% 15%–19% 20%–24% ≥25%
Obesity Trends* Among U.S. AdultsBRFSS, 2002 (*BMI ≥30, or ~ 30 lbs. overweight for 5’ 4” person) No Data <10% 10%–14% 15%–19% 20%–24% ≥25%
Obesity Trends* Among U.S. AdultsBRFSS, 2003 (*BMI ≥30, or ~ 30 lbs. overweight for 5’ 4” person) No Data <10% 10%–14% 15%–19% 20%–24% ≥25%
Obesity Trends* Among U.S. AdultsBRFSS, 2004 (*BMI ≥30, or ~ 30 lbs. overweight for 5’ 4” person) No Data <10% 10%–14% 15%–19% 20%–24% ≥25%
Obesity Trends* Among U.S. AdultsBRFSS, 2005 (*BMI ≥30, or ~ 30 lbs. overweight for 5’ 4” person) No Data <10% 10%–14% 15%–19% 20%–24% 25%–29% ≥30%
Obesity Trends* Among U.S. AdultsBRFSS, 2006 (*BMI ≥30, or ~ 30 lbs. overweight for 5’ 4” person) No Data <10% 10%–14% 15%–19% 20%–24% 25%–29% ≥30%
Obesity Trends* Among U.S. AdultsBRFSS, 2007 (*BMI ≥30, or ~ 30 lbs. overweight for 5’ 4” person) No Data <10% 10%–14% 15%–19% 20%–24% 25%–29% ≥30%
Obesity Trends* Among U.S. AdultsBRFSS, 2008 (*BMI ≥30, or ~ 30 lbs. overweight for 5’ 4” person) No Data <10% 10%–14% 15%–19% 20%–24% 25%–29% ≥30%
Obesity Trends* Among U.S. AdultsBRFSS, 2009 (*BMI ≥30, or ~ 30 lbs. overweight for 5’ 4” person) No Data <10% 10%–14% 15%–19% 20%–24% 25%–29% ≥30%
Obesity Trends* Among U.S. AdultsBRFSS, 2010 (*BMI ≥30, or ~ 30 lbs. overweight for 5’ 4” person) No Data <10% 10%–14% 15%–19% 20%–24% 25%–29% ≥30%
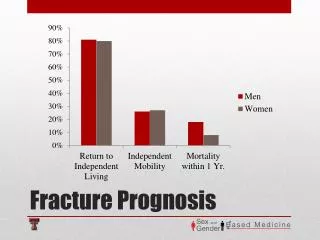
second, we have to take a fresh look at our safety record • IOM “To Err is Human” estimate • 44,000-98,000 deaths in hospitals due to errors in care • 34.4 million hospitalizations per year • Rate = 1300-2800 deaths per million hospitalizations • US Airlines: 2002-2010 • Rate = 1.74 deaths per million flights • Hospital care is 750-1600 times less safe
third, we have to lower our costs • We’ve only seen the tip of the iceberg when it comes to deficit reduction. • We’re not going to be paid as much in the future. • This business strategy is how you will earn your margin.
last but not least, we have to engage in the political process • Cigarette tax—successful • Peer review—successful • Medicaid expansion—???
u.s. supreme court • 5-4 decision to uphold ACA • Individual mandate stands…as a tax • Medicaid expansion cannot be coerced; states must be allowed to opt out
south carolina reaction “South Carolina will NOT expand Medicaid, or participate in any health exchanges. I WILL do everything I can to get Mitt Romney elected and work to strengthen our Senate so that we can repeal this unamerican policy.” Governor Nikki Haley Facebook July 1, 2012 “We’re not going to be one of the states to jump on the bandwagon. We’re certainly not going to expand Medicaid up to amounts the Obama administration would force us to.” Director Tony Keck
some background • January 1966. Only six states originally participated when the program launched: Hawaii, Illinois, Minnesota, North Dakota, Oklahoma, Pennsylvania • 27 states signed on later that year • 11 states joined in 1967 • 8 more states (southern) joined in 1970 • Arizona last to join in 1982 • Eventually all states participated in basic program and SCHIP (enacted in 1997)
some likely state options • Red states “opt-out” • Red states make noise… but then take the money • Red states put some in Medicaid… punt rest to the exchange • States go in… on their own terms
why are states reluctant? • Oppose ACA…election-year issue • Administrative burden • 10 percent is still a big commitment • Fear the Federal government will not keep its financial commitment • FMAP blending proposals • Provider assessment restrictions • The “woodwork” effect