Download
1 / 49
490 likes | 690 Views
Image Processing Concepts. Color representation Linear transforms of images Other filters General image analysis schemes. visible. 10 2. 10 24. |. |. xrays. ultraviolet. infrared. microwaves. radiowaves. Gamma rays. nanometers. 400 nm. 700 nm. 500 nm. 600 nm.

E N D
Image Processing Concepts • Color representation • Linear transforms of images • Other filters • General image analysis schemes
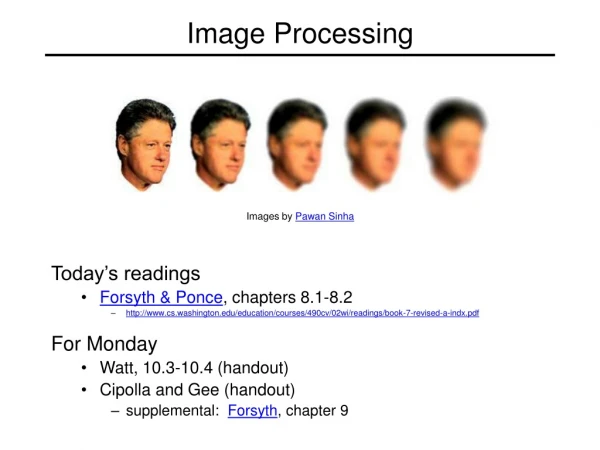
visible 102 1024 | | xrays ultraviolet infrared microwaves radiowaves Gamma rays nanometers 400 nm 700 nm 500 nm 600 nm Color Representation • Electromagnetic spectrum : 102 to 1024 cycles per second (Hz) • Visible spectrum: 400 to 700 nanometers in wavelength • Blue: 400 – 500 nm • Green: 500 – 600 nm • Red: 600 – 700 nm red blue green
Color Representation • Eye sees colors, daylight with cones • Eye sees black and white, night vision, with rods • Cones have higher resolution than rods because each cone has a nerve connected to it, whereas multiple rods are connected to a single nerve cell • Color image acquisition devices can collect the intensity in each of the Red, Green, and Blue ranges • Here, output of the device is a set of three planes, one each for Red, Green, and Blue
Color Representation • Each plane or band represents the amount of that range of wavelengths arriving to the image sensor for that band, at that pixel location • True color data typically has 8 bpp per plane or band, or 24 bpp – lots of data per pixel! • Other ways to use color data with fewer bpp – transform to other spaces to manipulate data
RGB Color Image Data . Blue Green Red
Color Representation • For many applications, RGB color image data is transformed into a different representation • These transformations can decouple the brightness information from the color information • The brightness component contains (gray value) intensity information, and the remaining 2 components contain color or chromaticity information • These representations can sometimes create a more people-oriented way of describing the 3 colors
Chromaticity Coordinates • Developed by an international group called CIE (Commission Internationale de l’Eclairage), who has studied extensively how color is perceived • Given (R,G,B) values, the chromaticity coordinates r, g, and b are • This transform normalizes the relative proportion of each color to the total at the pixel location and separates intensity information from chromaticity information • Can be used for computer vision/object recognition algorithms Intensity=
CMY Color Model • Each color is represented by the three secondary colors: • cyan (C) • magenta (M) • yellow (Y ) • Used mainly in devices, including color printers that deposit color pigments • To transform RGB to CMY:
CMY Color Model • Sometimes called the CMY subtractive model
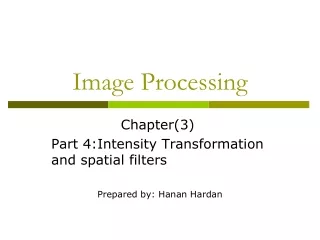
Hue-Saturation-Intensity Color Model • Hue-Saturation-Intensity (HSI) Model • Intensity: brightness of the color • Hue: shade of color (green, blue, orange, etc.) • Saturation: measure of how much “white” is in the color (pink is red with more white) • HSI based on heuristics relating to human perception • Also separates out intensity from chromaticity • Humans can view chromaticity as the hue and saturation parts of HSI
HSI Color Space white saturation intensity hue green zero full red blue black
Hue-Saturation-Intensity Color Model • Intensity is on vertical axis, ranging from low (black) to high (white) • Hue H is defined by an angle between 0 and 2 relative to the red direction, traversing clockwise from viewing above • 0 = pure red • 2/3 = pure green • 4/3 = pure blue • Saturation S models the purity of the color or hue • S = 1 means completely saturated • S = 0 means completely unsaturated • S = 0 means some shade of gray
Hue-Saturation-Intensity Color Model • HSI is more convenient to some graphics designers because it provides direct control of brightness and hue • Pastels are located near the I axis • Deep or rich colors are out at the periphery of the cone • Chromaticity values are more closely associated with the intrinsic character of a surface rather than the source that is lighting it • Because of this latter property, and the fact that HSI also normalizes the brightness, HSI can provide a better environment for automated computer vision algorithms including object recognition
HSI Color Model • Equations for converting RGB to HIS • Code also available in matlab (rgb2hsv)
YIQ Color Model • Developed by the International Telecommunications Union-Radio (ITU-R) • Used in commercial TV broadcasting NTSC standard • NTSC standard is an encoding that decouples luminance (Y) from chrominance (I = inphase and Q = quadrature) information • Allows these pieces of the data to be processed separately, or not processed at all (I and Q) • Luminance used by black and white TVs • All three parts used by color TVs
YIQ Color Model • In practice, luminance is encoded using more bits as human vision system is more sensitive to luminance or brightness variations than to the chromaticity values • There is also a similar model called YUV that is used in some digital video and JPEG and MPEG compression algorithms • One reason is that different number of bits can be used on the different components
YIQ and YUV Equations • YIQ • YUV
YCrCb Model • YCrCb equations are slightly different from the other luminance models • Used for MPEG1 and MPEG2
Use in Data Hiding • Color models are used for watermarking color still images • Watermarks are typically inserted in the luminance band, but not always • Not much has been done for color video watermarking – seems to be a wide open area
Principal Components Transform for Color • Applies the principal components transform (a statistical-based transform) to all the RGB vectors in an image • This determines the optimal rotation (wrt LMSE) of the standard coordinate axes so that most of the information (contained in eigenvector-eigenvalue pairs) is along one of the transformed axes (called the principal axis) representing one band or color • RGB data is three dimensional data • PCT is computationally expensive however
Pictorial Example of PCT (2D)(not just for color) y y y’ x’ wide range x x PCT finds change of basis from standard coordinates axes to one that minimizes the variance of range on y’ axis Original 2-D data points have a wide range in values on y axis y’ smaller range x’
Principle Component Transform • The PCT is a statistical transform • Based on the eigenvalues of the original matrix • The covariance matrix for the image must be computed – different for each image and thus computationally intensive • Minimizes the least mean square error among all linear transforms • Theoretically useful for many image processing algorithms • Used extensively in many data processing algorithms where data reduction is important • Reduction occurs in number of different components necessary to “adequately” represent the data
Palette-based Methods • Palette manipulation means changing the way the color or grayscale palette represents the image colors • Bit methods are used in palette manipulation schemes • Data hidden in “noise” of image • Often radical color shifts occur - can tip off that data is hidden • Use grayscale to overcome color shift problem
Palette-based Methods • Pseudo color 8-bit image: 256 different colors that are indexed by the numbers 0,…,255 • To insert information, for example, S-Tools reduces the number of colors from 256 to 32 and uses the lower LSB bit places to hide data • In this case, 8 colors are the same before data embedding; after data embedding, most 8 colors are very close visually in the image, but differ in their bit representation in the palette
Example: Hide an Image Example is courtesy of Neil Johnson and S. Jajodia’s paper, Exploring Steganography: Seeing the Unseen, Computer, pp. 26-34, 1998. Soviet strategic bomber base gathered by EROS (satellite data)
Capacity: number of bits of hidden data per pixel Capacity = 4 bits per pixel (high) Original Image White Noise Storm, spread spectrum S-Tools, LSB
Palette Methods • Color ci 10110 010 • Color ci+1 10110 011 • When palette is ordered by luminance there are groups of pixel colors that look identical to the eye • Luminance = 0.299R + 0.587G + 0.114B • Airfield is a 3 bit image put in last 3 bits of Renoir image • Very fragile – destroyed by any image manipulation • Very susceptible to easy analysis techniques
Change of Palette - Renoir Using S-Tools (a) Palette of original 8 bit GIF Renoir before inserting Airfield, sorted by luminance (b) Palette of 8 bit GIF of Renoir stego image after Airfield inserted, sorted by luminance
LSB and Palette Methods • Many different software tools available for LSB data embedding – see stegoarchive.com • All suffer from almost total lack of robustness: simply change LSB values and message will be overwritten • LSB palette methods leave patterns in the newly-created color palettes that can be analyzed (steganalysis)
Example: Insertion of a Paragraph of Text Text Hidden using StegoDos Original Image Text Hidden using White Noise Storm Text Hidden using S-Tools
Steganography using Mandelbrot Sets • Run Mandelsteg, input a file that you want to hide, and a fractal will be generated containing that file • See http://www.math.iastate.edu/danwell/Fframe.html For examples of Mandelbrot sets, or fractals
Steganography using Quantization of Raster-scanned Pixel Grayvalues • Quantization error in a predictive coding scheme can be used to hide information • The difference signal Δi between adjacent pixels xi and xi+1 is quantized; this is then used to transmit additional information • Predictive coding: Δi =Q(xi+1 - xi ) • Error is introduced when quantizing
Quantization • At receiving end, difference signal is dequantized and added to last sample value to create an estimate for xi • The stego-key in this steganographic algorithm is a table that assigns a specific bit to every possible value of Δi • Example: Δi Bit assignment -4 -3 -2 -1 0 1 2 3 4 0 1 0 1 1 1 0 0 1
Quantization • To store the i-th message bit in the cover-image, the quantized difference signal Δi is computed • If the assigned bit for Δi does not match the secret bit, then Δi is replaced with the nearest Δk whose assigned bit matches the value of the secret bit • The stream of Δi is then entropy-encoded (lossless) and sent (Huffman or arithmetic) • At the receiving end the values for Δi are decoded, and then the stego-key is used to create the list of 0s and 1s depicting the message
Image Processing Concepts • Linear transforms of images • Other filters • General image analysis schemes
Transform Domain Techniques for Steganography and Watermarking • Discrete Fourier Transform • Discrete Cosine Transform • Discrete Wavelet Transform • Mellin-Fourier Transform • Fresnel Transform • Lapped Orthogonal Transform • Related: • Singular Value Decomposition • Minimax Eigenvalue Decomposition
Transform Domain Techniques for Steganography and Watermarking • Discrete Fourier Transform and DWT combined • A DWT-DFT Composite Watermarking Scheme Robust to Both Affine Transform and JPEG CompressionKang, Xiangui (Dept. of Electronics Engineering, Sun Yat-Sen University); Huang, Jiwu; Shi, Yun Q.; Lin, YanSource:IEEE Transactions on Circuits and Systems for Video Technology, v 13, n 8, August, 2003, p 776-786 • Fresnel Transform • Digital image watermarking by Fresnel transform and its robustnessKang, Seok (Hokkaido Univ); Aoki, YoshinaoSource: IEEE International Conference on Image Processing, v 2, 1999, p 221-225. • Lapped Orthogonal Transform • Image data embedding system for watermarking using Fresnel transform Pereira, Shelby (Univ of Geneva); O Ruanaidh, Joseph J.K.; Pun, ThierrySource:Proceedings of SPIE - The International Society for Optical Engineering, v 3657, Jan 25-27, 1999, p 21-30. • Hough transform • A rotation scaling and cropping invariant second generation watermarking scheme based on hough transformZhen, Ji (Faculty of Information Engineering); Zhang, Jihong; Xiao, WeiweiSource:Chinese Journal of Electronics, v 12, n 1, January, 2003, p 126-131
Transform Domain Techniques for Steganography and Watermarking • Mellin-Fourier transform • Rotation, scale, and translation resilient watermarking for imagesLin, C.-Y.; Wu, M.; Bloom, J.A.; Cox, I.J.; Miller, M.L.; Lui, Y.M.;Image Processing, IEEE Transactions on , Volume: 10 , Issue: 5, May 2001 Pages:767 – 782 • Discrete Fourier transform • Capacity estimates for data hiding in compressed imagesRamkumar, M.; Akansu, A.N.;Image Processing, IEEE Transactions on , Volume: 10 , Issue: 8, Aug. 2001 Pages:1252 - 1263
Transform Domain Techniques for Steganography and Watermarking • Singular Value Decomposition • An SVD-based watermarking scheme for protecting rightful ownershipRuizhen Liu; Tieniu Tan;Multimedia, IEEE Transactions on , Volume: 4, Issue: 1 , March 2002 Pages:121 – 128 • Minimax Algebra • An Interlaced Minimax Eigenvector Decomposition Algorithm for Steganography, Davidson, J.L., and Kuan, D., in progress, 2004.
Discrete Cosine Transform • The forward equation, for image A, is • The inverse equation, for image B, is • Here
Discrete Cosine Transform • JPEG uses DCT to compress an image • Many different approaches to use DCT to hide information • Message is embedded in signal, not noise • Studies on visual distortions conducted by source coding community can be used to predict the visible impact of the hidden data in the cover image • Can be implemented in compressed domain, saving time
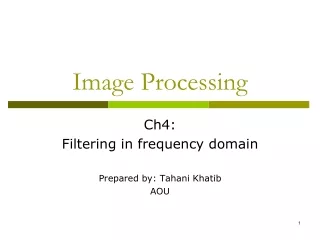
JPEG Compression Basic idea of JPEG: • Convert image to YIQ color space • Each color plane is partitioned into 8x8 blocks • Apply DCT to each block • Values are quantized by dividing with preset quantization values (in a table) • Values are then rounded to nearest integer
JPEG Compression Interface COMPRESSED IMAGE 8 X 8 BLOCK ENTROPY ENCODER DCT QUANTIZER (0,0) QUANTIZERTABLE
Steganography: One Approach using DCT • The sender and receiver agree ahead of time on location for two DCT coefficients in the 8 x 8 block • Middle frequencies with same quantization value: Location 1 is (4,1) & Location 2 is (3,2)
Steganography: DCT • The DCT is applied to each 8 x 8 block in the image producing a block Bi • Each block will encode a single bit, 0 or 1 • If the message bit is a 1 then the larger of the two values Bi(4,1) and Bi(3,2) is put in location (4,1), otherwise if the message bit is a 0, the smaller of the two values is put in location (4,1)
DCT Steganography • If the difference |Bi(4,1) - Bi(3,2)| < µ, then the values Bi(4,1) and Bi(3,2) are adjusted so that |Bi(4,1) - Bi(3,2)| > µ • This assures that the relative difference will not be lost when the compression is done • This last step can introduce distortion into image • The JPEG compression is performed (if desired) and then the resulting image is inversed transformed • Other modifications to this algorithm have been researched that overcome some of these limitations
DCT Steganography • To extract the data, the DCT is performed on each block, and the coefficient values at locations (4,1) and (3,2) are compared • If Bi(4,1) > Bi(3,2) then the message bit is a 1, otherwise it is a 0