Download
1 / 33
330 likes | 461 Views
The normal distribution. Examining data. When examining data on a single quantitative variable: Plot the data Look for overall pattern Calculate a numerical summary to briefly describe center and spread

E N D
Examining data • When examining data on a single quantitative variable: • Plot the data • Look for overall pattern • Calculate a numerical summary to briefly describe center and spread • When the overall pattern is quite regular, use a compact mathematical model to describe it.
Describing data with a smooth curve Distribution of blood pressure: The histogram shows 1,000 blood pressures
Describing data with a smooth curve Vocabulary scores of 947 seventh-grade students in Gary, Indiana.
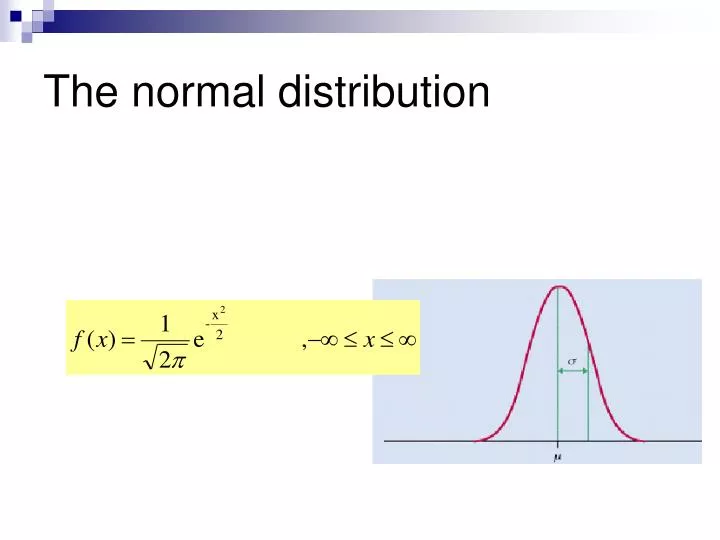
The normal curve(The Normal (Gaussian) distribution) Normal curve has a a particular symmetric, bell- shaped pattern, which can be summarized with this equation: Notation: e.g., SAT scores ~ N(505,1102)
Changing μ and σ Changing μ changes the center Changing σ changes the spread
The 68-95-99.7 rule f(x) -3σ-2σ -σμσ 2σ 3σ 68% of observations fall within σ of the mean μ. 95% of observations fall within 2σ of the mean μ. 99.7% of observations fall within 3σ of the mean μ.
Area under the curve represents proportion of observations = relative frequency From the histogram: Relative frequency of scores less than or equal to 6 is 0.303 (287 students out of total 947) From the normal curve: area under curve that is less or equal to 6 is 0.293
How can we calculate area under the curve? Problem: Integrating over the formula of the N(μ,σ) Curve involves difficult numerical computations. Also, For different sets of (μ, σ) we need to perform a new calculation The solution: we standardize the N(μ, σ) to have common μ and σ μ=0 and σ=1. There are tables that already performed these computations for the N(0,1)
The standard normal distribution Normal variables may have different μ and σ: All normal distributions are the same if we measure in units of size σ about the center μ. We can standardize each normal variable to have μ=0 and σ=1
The standard normal distribution • This is the normal distribution with μ=0 and σ=1 and denoted N(0, 1). • If the variable X has a normal distribution N(μ,σ) then
Example • Women’s height is N(64.5,2.52) Mary’s height is 67. Her standardized height is Mary’s height is 1 standard deviation above the mean
Example • Reading ability of third grade children is N(75, 102). • Reading ability of sixth grade children is N(82, 112). • David, 3rd grade, scored 80. • Nancy, 6th grade scores 80. • Who scored better relative to the their grade? • David’s standard score is (80-75)/10=0.5 • Nancy’s standard score is (80-82)/11=-0.18 • Relative to their grades,David scored higher than Nancy,
Using the Normal table to compute area under the Normal curve Table entry z
Examples of using the Normal table Φ(-1.5) = 0.0668 6.7% 1. - to -1.5 -1.5 Φ(-1.51) = 0.0655 6.6% 2. -∞ to -1.51 -1.51 1- Φ(1.5) = 1-.9332 = 0.0668 6.7% 3. 1.5 to ∞ 1.5 Φ(1.5)-Φ(-1.5)=0.9332-0.0668= =0.8664 86.6% 4. -1.5 to 1.5 -1.5 1.5
Problems: 15% of normal curve lies to right of what value? go to answer Find area under normal curve between -2 and -1 go to answer 85% lies to the right of ________ go to answer 25% lies to the right of ________ go to answer Go to Computations for a non-standard normal distribution
Answer: 15% a We are looking for a Go to the Normal table and look for value of z with 85% to its left. We denote it by z0.85 a = Z0.85 = 1.035 Back to problems
? Answer: -2 -1 Φ(-1)-Φ(-2) = 0.1587-0.0228 = 0.1357 13.5% Back to problems
85% Answer: x X = Z0.15=-1.035 Back to problems
Answer: We are looking for x X is the value of z with 85% TO ITS LEFT X = Z0.75= -0.67 25% x Back to problems
Computations for a non-standard normal distribution Assume that: What % of people have IQ between 85 and 115? • To use the normal table we have to transform to standard units What ? 85 115
To transform the point x to standard units compute: This tells us how many standard deviations x is from the average μ
Back to our IQ problem – Convert 85 and 115 to standard units: 68% 85 100 115 -1 0 1
What % of people have IQ below 100? 100 Answer: 50%
What % of people have IQ below 80? 80 100 -1.33 0 Convert 80 to standard units: Find area using normal table: Answer: 9.18%
What % of people have IQ above 140? 0 2.666 100 140 Convert 140 to standard units: Area to the left of 2.666 Area to the right of 2.666 1-0.9961=0.0039 Answer: 0.39%
What % of people have IQ between 100 and 120? 100 120 0 1.33 Convert 120 to standard units: Subtract the area below 0 from the area below 1.33: Area below 0 = 0.5 Area below 1.33 is 0.9082 0.9082-0.5=0.4082 Answer: 40.8%
What is the min score that someone must achieve to be in the top 5? 5% 100 x ? First, find what standard score is appropriate: Find IQ value that is 1.645 standard deviations above the mean X=124.75
Question: Scores on the SAT verbal test follow approximately N(505,1102) distribution. 1. What percent of students have scores higher than 700? ? 700 Transform 700 into standard units: (700-505)/110=1.77 1-0.9616=0.0384 1.77 Answer: 3.84%
? 2. What percent of students have scores between 505 and 700? 505 700 Transform to standard scores: (700-505)/110=1.77 (505-505)/110=0 ? Φ(1.77)-Φ(0)=0.9616-0.5=0.4616 0 1.77 Answer is 46.16%
3. How high must a student score in order to place in the top 10% of all students taking the SAT? 10% X First find the standard score that is below the top 10% Find SAT score that is equivalent to 1.285 z score X=645.8 Answer is 645.8
Homework stat 1000 • 1.43 page 59 • 1.63 page 63 • 1.77 page 87 • 1.83 page 88 • 1.86 page 89 • 1.87 page 89 • 1.89 page 89 • 1.91 page 90 • 1.95 page 90 • 1.115 page 97 Homework 2 Appear on Course web under: “assignments”
Go to Applet http://psych.colorado.edu/~mcclella/java/normal/handleNormal.html