Download
1 / 23
250 likes | 452 Views
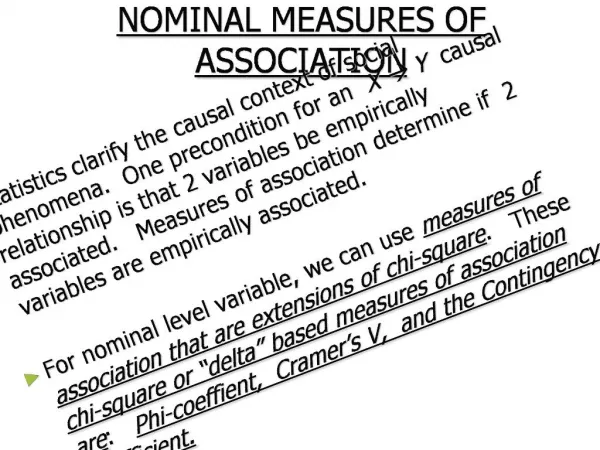
Measures of Association. Intermediate Epidemiology. Objectives. To play “name that rate” To discuss case-control study designs To discuss and calculate measures of association To discuss the design and measures of association of a study. Name that Rate. What’s the numerator

E N D
Measures of Association Intermediate Epidemiology
Objectives • To play “name that rate” • To discuss case-control study designs • To discuss and calculate measures of association • To discuss the design and measures of association of a study
Name that Rate • What’s the numerator • What’s the denominator • What is the type of rate
AIDS Rates per 100,000 Children <13 Years of Age by Race/Ethnicity, Reported in 1998*, United States 5 4 3.2 3 Rate per 100,000 2 0.9 1 0.2 0.1 0 Hispanic White Black Asian/Pacific American Not Hispanic Not Hispanic Indian/ Islander N=84 Alaska Native N=58 N=237 N=2 Race/Ethnicity N=0 *US Rate=0.7/100,000 N=382
AIDS Rates per100,000 Population Reported in1998 7.8 VT 3.4 3.3 2.5 0.9 6.2 4.0 NH 3.5 2.6 3.9 2.0 15.0 47.9 MA 1.2 7.3 12.9 RI 2.6 CT 20.3 14.5 4.3 14.8 6.1 NJ 26.3 8.2 6.6 10.8 23.4 DE 7.9 4.7 17.3 4.8 MD 31.9 14.7 8.1 7.1 DC 189.1 10.4 12.8 8.5 13.8 12.0 20.3 8.0 16.9 15.1 11.1 20.1 Rate per 100,000 36.5 21.8 <5 4.7 5 - 14.9 15+ 13.5 PR 44.3 VI 29.6
Proportion of AIDS Cases, by Race/Ethnicity and Year of Report,1985-1998, United States 70 White, not Hispanic 60 50 Black, not Hispanic 40 Percent of Cases 30 Hispanic 20 American Indian/ Asian/Pacific Islander 10 Alaska Native 0 1985 1987 1989 1991 1993 1995 1997 Year of Report
AIDS Cases in Adult/Adolescent Women by Race/Ethnicity per 100,000 Population, Reported in 1998, United States Cases Rate Race/Ethnicity 2,031 White, not Hispanic 2 6,775 Black, not Hispanic 50 Hispanic 2,055 17 59 1 Asian/Pacific Islander American Indian/ 4 30 Alaska Native 10,998 10 Total* *Includes 48 women whose race/ethnicity is unknown.
Percent of Perinatally HIV Exposed or Infected Children who Received or whose Mothers Received any ZDV* Born1993-March 1998 in 29 States‡, United States 100 80 60 Percent Receiving Zidovudine 40 20 0 1996 1993 1994 1995 1997 1998 N=1260 N=1313 N=1271 N=1315 N=1291 N=281 Quarter-Year of Birth * Any ZDV=Prenatal, intrapartum, or neonatal receipt of Zidovudine to reduce perinatal HIV transmission ‡ Includes 29 areas that have conducted pediatric HIV Surveillance since 1993; data reported through March 1999
AIDS Cases by Region and Size of Place of Residence Reported in 1998, United States Non- Metropolitan Metropolitan metropolitan area 500,000 area 50,000- area population 499,999 population % % % Northeast 93.1 4.5 2.4 N=14,399 North Central 76.3 14.4 9.3 N=4,317 South 75.6 13.5 10.9 N=19,474 West 86.7 8.2 5.0 N=8,121
AIDS Cases Reported in 1998 and Estimated 1998 Population, by Race/Ethnicity, United States AIDS Cases Population N=48,269* N=274,766,000 71% 13% 12% 33% <1% 1% 1% 45% 4% 20% White, not Hispanic Asian/Pacific Islander Black, not Hispanic American Indian/ Alaska Native Hispanic *Includes 211 persons with unknown race/ethnicity
AIDS in Women, by Exposure Category and Age at Diagnosis, Reported in 1998, United States Age at Diagnosis (in years) 13-19 20-29 30-49 50+ Exposure Category N=150 N=2,015 N=7,683 N=1,150 % % % % Injection drug use 9 19 34 19 39 46 41 35 Heterosexual contact Transfusion recipient 2 1 3 1 Other/not identified* 48 34 30 39 *Includes patients whose medical record review is pending; patients who died, were lost to follow-u p, or declined interview; and patients with other or undetermined modes of exposure
Case-control study • Persons are categorized by disease status and then compared for their exposure status • The odds ratio is the measure of association (an estimate of relative risk) • The assumption is that the cases and controls originate from the same hypothetical source cohort. • When this assumption is not met, the results are susceptible to selection bias • Traditional method is case-based case-control study
Nested case-control or case-cohort • When cases are identified within a well defined cohort • Also known as a hybrid or ambi-directional study
Alternatives for selection of controls and a case-control study • Case-cohort - When the controls are randomly selected from a defined cohort at baseline. • Nested case-control – based on incidence density sampling (matching cases and controls on duration of follow-up) or risk-set sampling (or comparison of cases with a subset of the cohort members as risk of being cases at the time when each case occurs)
Case-crossover • Compares the exposure status of a case immediately before it’s occurrence with that of the same case at some other prior time • Appropriate for the study of acute (brief) exposures that produce transient change in risk of an acute condition (eg, MI and episodes of anger or sexual activity)
Matching • Performed to reduce confounding • Can be individually matched or frequency matched
Advantages of Matching • May be the only way to control some degrees of confounding (especially very strong confounding) • Tends to increase the statistical power • Logistically straight forward
Disadvantages of Matching • May be impossible to find a control • When matching is done, the association between the matched variables and the outcome can no longer be assessed • Also eliminates the ability to assess additive interaction between the matched variable and the exposure of interest • Special statistical tests need to be used • By matching you remove the representativeness of your controls • Once matching is done, it cannot be undone • No statistical power is gained if the matching variables are weak confounders
Relative Risk for a disease exposure RR = 75/100 = 3.00 25/100 C.I. (2.10 - 4.29)
Relative Risk for preventive intervention RR = 25/100 = .50 50/100 C.I. (.39-.79)