Download
1 / 22

E N D
2. Food Chains
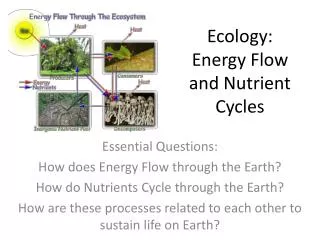
Although the term 'food chain' has entered into common usage, in most ecosystems food chains do not occur. The idea that energy flows along a chain of consecutive links made up of various consumers is unrealistic. As we will see shortly, trophic interactions are considerably more complex than a series of linear steps. Food chains are a useful beginning to illustrate the concept of trophic levels.
Trophic levels are a way of identifying what kinds of food an organism uses.
Primary producers obtain their energy from the sun or chemical sources and utilize inorganic compounds from the environment to make organic compounds.
Herbivores feed on primary producers that utilize the sun for energy
Carnivores feed on herbivores and other heterotrophic organisms.
Food Chains
Although the term 'food chain' has entered into common usage, in most ecosystems food chains do not occur. The idea that energy flows along a chain of consecutive links made up of various consumers is unrealistic. As we will see shortly, trophic interactions are considerably more complex than a series of linear steps. Food chains are a useful beginning to illustrate the concept of trophic levels.
Trophic levels are a way of identifying what kinds of food an organism uses.
Primary producers obtain their energy from the sun or chemical sources and utilize inorganic compounds from the environment to make organic compounds.
Herbivores feed on primary producers that utilize the sun for energy
Carnivores feed on herbivores and other heterotrophic organisms.
3. Food Chains
In food chains, the total number of trophic levels depends upon the location and number of different species.
In general, the highest trophic level is occupied by adult animals with no predators of their own. For example, killer whales would occupy the highest trophic level in an antarctic food chain.
Secondary production refers to the total amount of animal biomass produced in all trophic levels above the primary producers. That is, it reflects all heterotrophic production. Food Chains
In food chains, the total number of trophic levels depends upon the location and number of different species.
In general, the highest trophic level is occupied by adult animals with no predators of their own. For example, killer whales would occupy the highest trophic level in an antarctic food chain.
Secondary production refers to the total amount of animal biomass produced in all trophic levels above the primary producers. That is, it reflects all heterotrophic production.
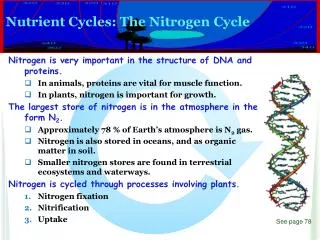
4. Nutrients
Inorganic nutrients are incorporated into cells during photosynthesis and chemosynthesis.
Examples of important nutrients are nitrogen, phosphorus, carbon and sulfur.
The flow of nutrients in a food chain is cyclical. A pool of nutrients resides in a trophic level until animals die or excrete it. Then decomposers can release it in a form that is utilizable by autotrophic organisms. Nutrients
Inorganic nutrients are incorporated into cells during photosynthesis and chemosynthesis.
Examples of important nutrients are nitrogen, phosphorus, carbon and sulfur.
The flow of nutrients in a food chain is cyclical. A pool of nutrients resides in a trophic level until animals die or excrete it. Then decomposers can release it in a form that is utilizable by autotrophic organisms.
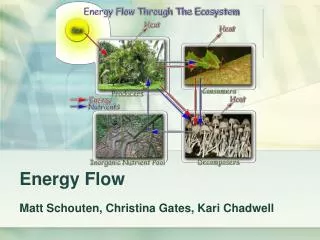
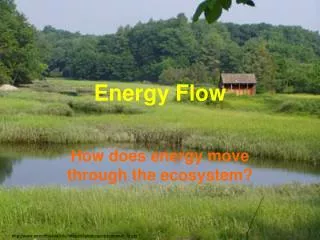
5. Energy
Unlike nutrients, the flow of energy is not cyclical but rather is unidirectional. Energy is captured by primary producers and transferred to higher trophic levels. At each transfer, only a fraction of the energy is passed on and much is lost.
These losses are in the form of heat and inefficiencies in processing and assimilating energy.
Thus, the total available energy declines as one moves up trophic levels in a food chain.
This places a limit on the number of trophic levels that can exist. At some point, there is too little energy available to sustain further transfers. Energy
Unlike nutrients, the flow of energy is not cyclical but rather is unidirectional. Energy is captured by primary producers and transferred to higher trophic levels. At each transfer, only a fraction of the energy is passed on and much is lost.
These losses are in the form of heat and inefficiencies in processing and assimilating energy.
Thus, the total available energy declines as one moves up trophic levels in a food chain.
This places a limit on the number of trophic levels that can exist. At some point, there is too little energy available to sustain further transfers.
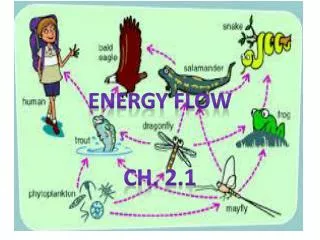
7. Example Food Chain
This simplified food chain illustrates links in a food chain. The chain begins with diatoms which are consumed by herbivorous copepods. The copepods are consumed by carnivorous zooplankton (in this case, chaetognaths) and the chaetognaths are consumed by planktivorous fishes.
In a food chain, energy moves in a linear fashion from producers through consumers. Example Food Chain
This simplified food chain illustrates links in a food chain. The chain begins with diatoms which are consumed by herbivorous copepods. The copepods are consumed by carnivorous zooplankton (in this case, chaetognaths) and the chaetognaths are consumed by planktivorous fishes.
In a food chain, energy moves in a linear fashion from producers through consumers.
8. Transfer Efficiencies
Only a portion of the energy in one trophic level makes its way to the next. This is called the transfer efficiency. The currency may be energy or biomass.
Transfer Efficiencies
Only a portion of the energy in one trophic level makes its way to the next. This is called the transfer efficiency. The currency may be energy or biomass.
9. Transfer Efficiency Example
Let's assume that we wish to calculate the transfer efficiency between primary producers and herbivorous copepods.
Our currency will be grams of carbon.
The annual production of primary producers is 150gC per square meter per year.
The annual production of copepods is 25 gC per square meter per year.
The transfer efficiency is then 25/150 or about 17%.
Typical transfer efficiencies from primary producers to herbivores are about 20% while efficiencies between higher levels are about 10%. Transfer Efficiency Example
Let's assume that we wish to calculate the transfer efficiency between primary producers and herbivorous copepods.
Our currency will be grams of carbon.
The annual production of primary producers is 150gC per square meter per year.
The annual production of copepods is 25 gC per square meter per year.
The transfer efficiency is then 25/150 or about 17%.
Typical transfer efficiencies from primary producers to herbivores are about 20% while efficiencies between higher levels are about 10%.
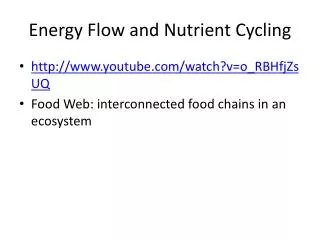
12. Food Webs
Remember that food chains are an artificiality that don't really exist. In reality, the trophic linkages between organisms are much more complicated. Most organisms have more than one predator and the diets of animals shift as they develop.
Food webs reflect the complexity of trophic interactions. Food Webs
Remember that food chains are an artificiality that don't really exist. In reality, the trophic linkages between organisms are much more complicated. Most organisms have more than one predator and the diets of animals shift as they develop.
Food webs reflect the complexity of trophic interactions.
14. Food Webs ...
There are many trophic categories that are too complicated to fit into the simple concept of a food chain.
Many animals are omnivorous. That means that they consume a wide variety of prey. An omnivore might consume diatoms and crustacean larvae. Thus, it's feeding at trophic levels one and two.
Detritivores feed on dead organic matter that can be derived from a wide range of sources at varying trophic levels.
During development (ontogeny) animals often shift their diet as they grow larger. Consider a tuna which may begin by feeding on copepods and zooplankton but which progresses to large fish at adulthood.
Parasites complicate the picture because they may have a number of different hosts of different trophic status. Food Webs ...
There are many trophic categories that are too complicated to fit into the simple concept of a food chain.
Many animals are omnivorous. That means that they consume a wide variety of prey. An omnivore might consume diatoms and crustacean larvae. Thus, it's feeding at trophic levels one and two.
Detritivores feed on dead organic matter that can be derived from a wide range of sources at varying trophic levels.
During development (ontogeny) animals often shift their diet as they grow larger. Consider a tuna which may begin by feeding on copepods and zooplankton but which progresses to large fish at adulthood.
Parasites complicate the picture because they may have a number of different hosts of different trophic status.
15. Food Webs ...
The presence of two competitors feeding on the same prey items may alter the availability of energy to higher trophic levels. Consider the example on the left where carnivorous zooplankton of species A feed on herbivorous zooplankton and are themselves consumed by fishes.
Let's introduce a second species of carnivorous zooplankton. Species B isn't consumed by fish but shares the supply of herbivorous zooplankton with species A.
The result is that the availability of energy to fishes is diminished.
Food webs contain many of these sorts of competitive relationships and prey preference. Food Webs ...
The presence of two competitors feeding on the same prey items may alter the availability of energy to higher trophic levels. Consider the example on the left where carnivorous zooplankton of species A feed on herbivorous zooplankton and are themselves consumed by fishes.
Let's introduce a second species of carnivorous zooplankton. Species B isn't consumed by fish but shares the supply of herbivorous zooplankton with species A.
The result is that the availability of energy to fishes is diminished.
Food webs contain many of these sorts of competitive relationships and prey preference.
16. An Ecological Mystery
Let's take a look at a food web in the north Pacific ocean that has changed substantially in the past decade. An Ecological Mystery
Let's take a look at a food web in the north Pacific ocean that has changed substantially in the past decade.
19. An Ecological Mystery
Sea otters are marine mammals that live in kelp beds along the western coast of North America from Baja Mexico to Alaska. Once hunted to near extinction, their protection has been one of the success stories of conservation.
In the 1970's, sea otter populations were healthy and expanding throughout their range.
Scientists noted that by the 1990's some populations of sea otters were declining.
One possibility was that the animals had moved rather than died.
In 1993, an 800 km long section of the Aleutian Islands was surveyed and the results were alarming. The sea otter population had declined by 50%. An Ecological Mystery
Sea otters are marine mammals that live in kelp beds along the western coast of North America from Baja Mexico to Alaska. Once hunted to near extinction, their protection has been one of the success stories of conservation.
In the 1970's, sea otter populations were healthy and expanding throughout their range.
Scientists noted that by the 1990's some populations of sea otters were declining.
One possibility was that the animals had moved rather than died.
In 1993, an 800 km long section of the Aleutian Islands was surveyed and the results were alarming. The sea otter population had declined by 50%.
20. Vanishing Sea Otters
In 1997 the Aleutian survey was repeated and the results were worse. Sea otter populations had declined by 90%. In 1970, some 53, 000 sea otters lived in the study area. By 1997, that population was down to about 6,000 animals.
A number of possible causes were considered. These included reproductive failure, starvation, pollution and disease. The problem with these hypotheses was that there was no evidence of dead otters that might support the idea of some epidemic or source of mortality that would kill many over a wide range. Vanishing Sea Otters
In 1997 the Aleutian survey was repeated and the results were worse. Sea otter populations had declined by 90%. In 1970, some 53, 000 sea otters lived in the study area. By 1997, that population was down to about 6,000 animals.
A number of possible causes were considered. These included reproductive failure, starvation, pollution and disease. The problem with these hypotheses was that there was no evidence of dead otters that might support the idea of some epidemic or source of mortality that would kill many over a wide range.
21. Cause of the Decline
In 1991, one scientist noticed an orca (killer whale) eating a sea otter. This was unusual because sea lions and seals are the normal prey for orcas and a small animal such as a sea otter wouldn't provide much nutrition.
At one site called Clam Lagoon, populations of otters remained healthy. Interestingly, that site was inaccessible to orcas.
It turned out that orcas had indeed been responsible for the decline in otters. A decline in the abundance of their usual prey forced them to switch to otters.
Not all the orcas needed to switch to generate the mortality observed along the Aleutians. As few as 4 orcas feeding solely on otters could have produced an impact of the magnitude observed. A single orca could consume about 1,825 otters per year. Cause of the Decline
In 1991, one scientist noticed an orca (killer whale) eating a sea otter. This was unusual because sea lions and seals are the normal prey for orcas and a small animal such as a sea otter wouldn't provide much nutrition.
At one site called Clam Lagoon, populations of otters remained healthy. Interestingly, that site was inaccessible to orcas.
It turned out that orcas had indeed been responsible for the decline in otters. A decline in the abundance of their usual prey forced them to switch to otters.
Not all the orcas needed to switch to generate the mortality observed along the Aleutians. As few as 4 orcas feeding solely on otters could have produced an impact of the magnitude observed. A single orca could consume about 1,825 otters per year.
23. This diagram illustrates the cascade that swept through the food web.
Declines in oceanic fish due to overfishing and climatic changes led to a reduction in food for sea lions and seals. This forced the orcas to enter into the coastal waters where they consumed sea otters.
Sea otters normally feed on sea urchins. Without this control, the urchins increased in abundance.
Urchins graze on kelp, particularly on the holdfast and large numbers of urchins damaged kelp forests. The decline in the kelp forests has had an impact on many others species ranging from sea ducks to sea stars. This diagram illustrates the cascade that swept through the food web.
Declines in oceanic fish due to overfishing and climatic changes led to a reduction in food for sea lions and seals. This forced the orcas to enter into the coastal waters where they consumed sea otters.
Sea otters normally feed on sea urchins. Without this control, the urchins increased in abundance.
Urchins graze on kelp, particularly on the holdfast and large numbers of urchins damaged kelp forests. The decline in the kelp forests has had an impact on many others species ranging from sea ducks to sea stars.