Download
1 / 23
280 likes | 910 Views
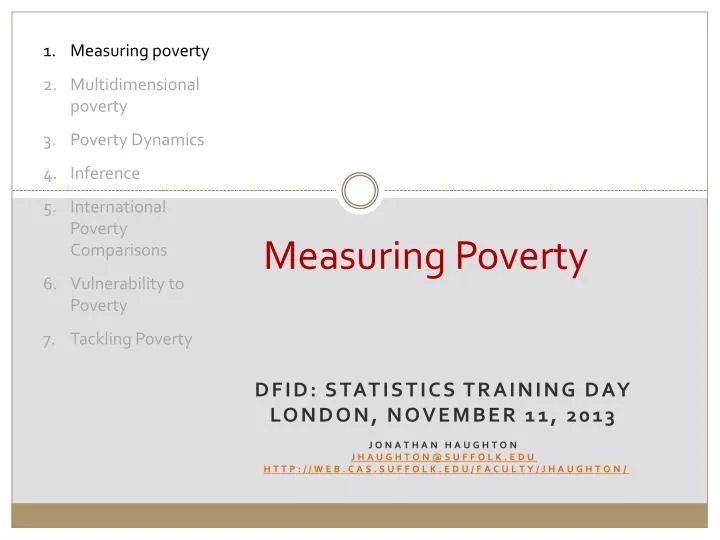
Measuring Poverty. Measuring poverty Multidimensional poverty Poverty Dynamics Inference International Poverty Comparisons Vulnerability to Poverty Tackling Poverty. DFID: Statistics Training Day London, November 11, 2013 Jonathan Haughton jhaughton@suffolk.edu

E N D
Measuring Poverty Measuring poverty Multidimensional poverty Poverty Dynamics Inference International Poverty Comparisons Vulnerability to Poverty Tackling Poverty DFID: Statistics Training Day London, November 11, 2013 Jonathan Haughton jhaughton@suffolk.edu http://web.cas.suffolk.edu/faculty/jhaughton/
Outline • What? • Why? • Monetary measures: • What measure of welfare? • What poverty line? • How summarize the data? DFID Statistics Training Day, November 11, 2013
What is poverty? • “a pronounced deprivation in well-being” • Conventional view: not enough money • Sen: Lack of capabilities to function in society. • Treated in part 2 • Distinct from, but related to • Vulnerability (“ex ante poverty”) • Inequality • A kissing cousin, if relative poverty line used DFID Statistics Training Day, November 11, 2013
Why measure poverty? … given that it is expensive to measure • Keep the poor on the agenda • Target interventions (domestic, international) • Monitor and Evaluate projects, policies • Evaluate institutions World Bank: “Our dream is a world free of poverty” N.B. Role of Poverty Reduction Strategy Papers DFID Statistics Training Day, November 11, 2013
Aside: Surveys • Poverty measures are based on survey data • Ask: • Is sample frame representative? • Sample size? • Stratified? • If yes, use weights for summary statistics • Clustering? • If yes, adjust when measuring standard errors • Cross-section, or also panel? • What indicator(s) collected? How? (e.g. diary?) • Good data cleaning? Quality control? • LSMS have set a high standard • EU-SILC: Income and living standards; “social cohesion” DFID Statistics Training Day, November 11, 2013
What welfare indicator? • “Utility”, as proxied by (typically) • Income per capita, or • Consumption per capita • Candidate 1: Income Income ≡ Consumption + Δ net worth Net worth is hard to measure (e.g. livestock) What time period? Year? Lifetime? Income often seriously understated DFID Statistics Training Day, November 11, 2013
Expenditure? • Candidate 2: Expenditure • Include own-production and purchases • More stable than income; better tracks “lifetime income” Problems • Many items • Under-reporting, especially luxuries • Sensitive to questions • e.g Vietnam tobacco DFID Statistics Training Day, November 11, 2013
Technical considerations • Durables • Mainly depreciation + interest costs; need value • Housing • Ask hypothetical about rentals? • Weddings and funerals DFID Statistics Training Day, November 11, 2013
Adult equivalents • Commonly: expenditure per capita • But: individual needs differ; economies of scale in consumption • OECD scale: AE = 1 + 0.7 (Nad – 1) + 0.5 Nch • Elegant: AE = (Nad + αNch)^θ e.g. α = 0.7; θ = 0.8. • Deaton and Zaidi (1998) “There are so far no satisfactory methods for estimating economics of scale” [in consumption] DFID Statistics Training Day, November 11, 2013
Other measures • Calories per day • Food share of consumption • Nutritional outcomes • Peer or observer assessments • Self-assessment • E.g. Social Weather Stations, the Philippines DFID Statistics Training Day, November 11, 2013
Poverty Lines • Relative: “the poor are always with us” • Line giving poorest 20% (quintile) • EU: 60% of national median equivalised disposable income (OECD scale): “at risk of poverty” • Absolute: for comparisons over time, states • World Bank “dollar a day” • Cost-of-basic-needs poverty lines • Food poverty line (i.e. cost of enough food, only) • US: Mollie Orshansky. 3 times cost of adequate food. Updated over time to reflect price changes. Cash only. DFID Statistics Training Day, November 11, 2013
Different Poverty Lines DFID Statistics Training Day, November 11, 2013
Cost of Basic Needs Method • Widely used, but with variations • Pick a nutritional requirement for good health • e.g. 2,100 kcals per person per day • Estimate the cost of buying enough food for this • e.g. Cost of diet of someone consuming 2,100±100 kcals/cap/day • Add a non-food component • e.g. Non-food spending of someone consuming 2,100±100 kcals/cap/day • Update over time by revising prices DFID Statistics Training Day, November 11, 2013
Measures of Poverty • Headcount Index: P₀ = Np/N • Popular, easy to understand • Does not pick up depth of poverty • Assumes equal sharing within household DFID Statistics Training Day, November 11, 2013
Poverty Gap Index • Poverty Gap Index • Does not reflect inequality among the poor • EU: “Relative median at-risk-of-poverty gap” DFID Statistics Training Day, November 11, 2013
FGT • Foster-Greer-Thorbecke • Poverty gap squared: α=2 • Choice makes a modest difference DFID Statistics Training Day, November 11, 2013
Problem to try: Which country is poorest? z=126 DFID Statistics Training Day, November 11, 2013
Other measures • Sen-Shorrocks-Thon • Watts • Time Taken to Exit DFID Statistics Training Day, November 11, 2013
Reading • Haughton & Khandker, chapters 1-4 Jonathan Haughton & Shahidur Khandker, 2009, Handbook on Poverty and Inequality, World Bank, Washington DC. Can be downloaded from my website. DFID Statistics Training Day, November 11, 2013