Download
1 / 29
290 likes | 309 Views
Learn to analyze the difference between two sample means using test statistics. Discover how to calculate confidence intervals and interpret sampling distributions. Explore the significance of differences and reject null hypotheses with known probability distributions.

E N D
PY1PR1 lecture 4: Comparing two sample means Dr David Field
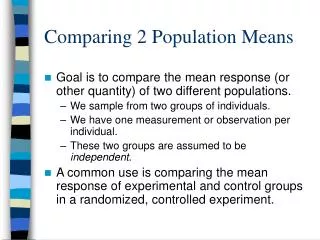
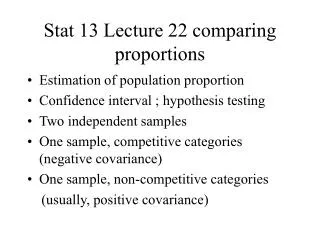
Comparing two samples • Researchers often begin with a hypothesis that two sample means will be different from each other • In practice, two sample means will almost always be slightly different from each other • Therefore, statistics are used to decide whether the observed difference between two samples is meaningful or not • To do this, we test the null hypothesis that the two samples were both drawn randomly from the same population
Test statistics • To test the null hypothesis we need to quantify the strength of the evidence against it • This is done using test statistics • when the test statistic is larger, there is more evidence against the null hypothesis • What makes test statistics different from other statistics is that they have known probability distributions when the null hypothesis is true • we know the p of a test statistic of 1 or >1 occurring purely due to sampling variation from a null distribution • the p of a test statistic of 2 or > 2 will be lower than the p of a test statistic of >1 • if the p of the test statistic occurring purely due to sampling variation is < 0.05 (5%) the null hypothesis is rejected • Test statistics with known probability distributions under the null hypothesis include z, t, r, and chi-square • Mean, Median, SD are not test statistics
Confidence intervals as a test • Lecture 2 explained how to calculate a 95% confidence interval around a single sample mean • this was achieved using the SE of an inferred sampling distribution of the mean • collecting two samples and calculating two separate confidence intervals establishes that the two samples are from different populations if the confidence intervals do not overlap • but it does not allow a conclusion to be reached when the confidence intervals do overlap • To calculate a test statistic to directly test the null hypothesis we need to consider a slightly different sampling distribution • the sampling distribution of the difference between two means
Sampling distribution of the difference between two means • Normally, you are only able to measure 2 samples and calculate 2 means and the difference between them • But test statistics are based on properties of an assumed underlying sampling distribution of the difference between two means • The best way to understand test statistics is to consider unusual or artificial examples where full population data and sampling distributions are available • Therefore….
The two populations Mean 4.0 SD 0.4 Mean 4.5 SD 0.8
Sampling distribution of the difference between two means 9.4.1 • Take a large number of samples of 5 cats from the UK population • Arrange the samples in pairs and for each pair calculate the difference between the two means • Half the differences will be negative and half of them will be positive • Therefore the mean of this sampling distribution will be zero. This differs from the sampling distribution of a single sample mean, which has a mean equal to the underlying population mean • The sampling distribution of the difference between two means will be normally distributed
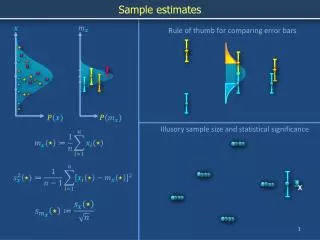
ORIGINAL DISTRIBUTION is the population frequency distribution of weight differences between pairs of individual cats • Black solid curves are sampling distributions of weight differences between 2 sample means, for samples of of 4, 16, and 64 cats
Standard error of the difference between two sample means • σ (sigma) means the SD of the population of difference scores • N1 and N2 are the two sample sizes • the formula allows the SE of the sampling distribution to be calculated when the two samples differ in size • Like the SE of a single sample mean, this SE gets smaller as N increases and gets smaller as the SD gets smaller • Smaller SE makes it easier to reject null hypothesis σ 1 1 = SE + N1 N2
SE of the difference between mean Kg for two samples of 5 UK cats • 1/5 (or 1/2, or 1/3, or 1/20) is a number less than 1 • The square root makes the number larger, but never makes it greater than 1 • So, the population SD gets multiplied by a number smaller than 1, which is why the SE is always smaller than the SD of the population 1 1 = 0.8 0.506 Kg + 5 5
For the highlighted pair of samples the difference between the means is 0.5Kg • What percentage of sample pairs have a difference of 0.5Kg or larger? • If we expressed the difference of 0.5Kg in units of SE we could answer that question • This is because the converted score is a Z score Remember that in this theoretical example we know that both samples are from the same population, and the purpose is to calculate the p of a difference this big or bigger occurring when that is the case
Converting the difference between 2 sample means to a Z score The difference between the means 0.5 Z = 1 0.8 1 + The SE formula 5 5 Z = 0.99
16.1% of the total area under the normal curve corresponds to values of 0.99 or greater 16.1% of differences between means of sample size 5 will have Z scores greater than 0.99
From Z back to Kg • So, 16.1% of differences between pairs of samples of N=5 drawn from the population of UK cats will be 0.5Kg or larger • This is the same as saying the probability of a single comparison producing a difference of 0.5Kg or greater is 16.1%
What if the population SD (σ) is unknown? • Usually, researchers only have two samples to compare, and the population parameters are unknown. • In this situation the sample SD is used instead of the population SD, and the SE formula is modified SD12 SD22 SE = + N1 N2
For the highlighted pair of samples the mean difference is 0.5Kg • The sample SD’s will be used in the modified formula instead of the unknown population SD
Converting the difference between 2 means to a Z score when σ is unknown 0.5 Z = 0.52 0.72 + 5 5 0.5 = 1.29 0.38
How much evidence is there against the null hypothesis? • 9.8% of Z statistics are > 1.29, so we would not conclude that the two samples of cats are from different countries if we used the 5% cut off • In this example, we know that the two samples were from the same population, so we can verify that this was the correct conclusion • On the other hand, if two samples had a mean difference of 0.8Kg, then assuming the sample SD’s remain the same, the resulting Z statistic would be 2.07 • Only 1.9% of Z statistics are greater than 2.07, and if we didn’t know that the two samples came from the same population we would reject the null hypothesis, and by doing so commit a Type I error
The Z score of the difference between samples of 5 UK and 5 Greek cats 4.1 – 3.7 Z = 0.52 0.32 + 5 5 0.4 = 1.53 0.26
How much evidence is there against the null hypothesis? • 6.3% of Z statistics are > 1.53, so we would be unable to conclude that the two samples of cats are from different countries if we used the 5% cut off • In this example we know that the two samples were from different populations, so we have committed a Type II error by failing to reject the null hypothesis • Type II errors like this are common when the sample size is small
The Z score of the difference between samples of 12 UK and 12 Greek cats 4.6 – 4.1 Z = 0.62 0.22 + 12 12 0.5 = 2.73 0.18
How much evidence is there against the null hypothesis? • 0.032% of Z statistics are > 2.73, so we would be conclude that the two samples of cats are from different countries if we used the 5% cut off • In this example we know that the two samples were from different populations, so we have correctly rejected the null hypothesis
Important caveat • What I have described today is called a “Z test” • But, the formula for estimating the SE of the difference between 2 means used in the Z test is only accurate when the individual sample sizes are 30 or more • This is because the estimate of the population SD is not accurate • There is a different test that uses an accurate estimate of the SE when sample size is less than 30 • the “t test”, which is covered in the next lecture • Because the t test produces the same results as the Z test when the sample size is >30 computer programs like SPSS generally only give the option of a t test • Both tests work on the same principle, but the Z test is less complicated and easier to understand
General principle of test statistics 2.6.1 • All test statistics have known probability distributions when variation in the DV due to the IV is zero (i.e. the null hyp is true) • Z has the distribution of the standard normal distribution • Other test statistics have different shaped distributions, and different calculation formulas, but the general principle for converting the test statistic to a p value is the same. variation in the DV due to the IV = test statistic other variation in the data (error)
List of statistical terms for revision • This lecture made use of terms introduced in previous lectures, and only introduced one new term • sampling distribution of the difference between two means