Download
1 / 57
570 likes | 822 Views
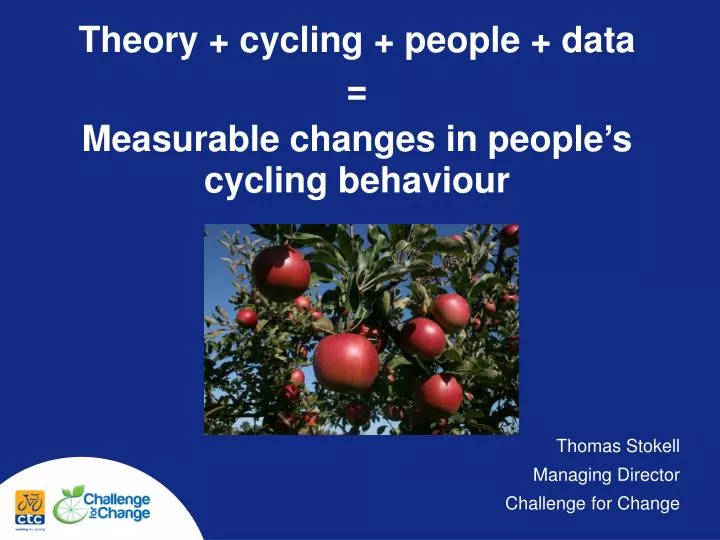
Theory + cycling + people + data = Measurable changes in people ’ s cycling behaviour Thomas Stokell Managing Director Challenge for Change. Everyone can cycle. …even Gaz. The amazing 39 stone cyclist. Cycling is for everyone…. But how do we get more people cycling?. Today.

E N D
Theory + cycling + people + data = Measurable changes in people’s cycling behaviour Thomas Stokell Managing Director Challenge for Change
Everyone can cycle …even Gaz
Cycling is for everyone… But how do we get more people cycling?
Today Applying behaviour change theory Case-study Research with 16,000 new and existing cyclists.
Measurable change is possible Survey Data - former 'non-cyclists' 3 Months post Challenge 37% now cycle at least once a week 21% now cycle regularly (2-3 days or more each week) 19% now cycle to work at least once a week N = 1,664
Self Perception Theory Give people a positive cycling experience Break down old perceptions. E.g. hard, scary Create new perceptions. E.g. easy and fun Greatly increases their likelihood of taking up cycling Assist people to become confident and capable commuter cyclists More people cycling
What people say... “The Cycle Challenge reminded me that I can do it, and not only that, enjoy it!” “I enjoyed it more than I thought I would, it was easier than I thought and I like the idea of keeping fit and travelling to work at the same time.” “Up until July of this year I hadn't rode a bike in 15 - 20 years! So I'm really pleased that I have kept to cycling 2-3 times a week ever since.”
Take Home No. 1 Give people a short, positive experience
Self-Efficacy Our belief in our ability to achieve certain goals. Similar to self confidence but focuses on the beliefs people hold towards one behaviour specifically.
Self Efficacy Confidently and competently cycling for transport Trial cycling for work Cycling Event Cycle Skills Training Recreational Cycling (off road/quite roads) Positive Cycling Experience
Take Home No. 2 Understand where people are at And what the next step for them is
Evaluation Methodolgy Online Questionnaires Short, focussed = high response rate Surveys at: • Baseline • 2 weeks post Challenge • 3 months post Challenge
Data Set 57,000 participants - worldwide 16,100 UK participants 5,217 non-cyclists
Data Set 57,000 participants - worldwide 16,100 UK participants 5,217 non-cyclists 32% response rate 1,666 non-cyclist respondents
Objective 1: Encourage non-cyclists to take up cycling
Objective 2: Encourage people who are already cycling to cycle more often
Objective 3: Encourage people to cycle for transport purposes
Applications • Targeted messaging – online and email • Targeted follow-on interventions • Further research • - including next 4%
Baseline non-cyclists with their current cycling behaviour, segregated by gender
Impact of hills and Infrastructure Cycle friendliness and topography of each city that has been analysed
Graph to show cycle friendliness of each Challenge site for non-cyclists at baseline who are now cycling once a week or more post-Challenge Friendly
Graph to show non-cyclists at baseline with their current cycling behaviours, segregated by cycle friendliness
Non-cyclists at baseline who are now cycling once a week or more post-Challenge, segregated by the cycle-friendliness of their town and gender. (M=602, F=1,039)
Graph to show non-cyclists at baseline now cycling once a week or more, segregated by site and split by topography
Non-cyclists at baseline with their current cycling behaviour, segregated by topography
Graph to show non-cyclists at baseline now cycling once a week or more segregated by topography and gender (M=602, F=1,039)
Graph to show non-cyclists at baseline who are now cycling once a week or more, segregated by site and gender
Food for thought • Hills are not a barrier for some people. • We can achieve measurable increases in cycling with current levels of cycling infrastructure. • Give people a positive experience. • Understand where people are currently at. • Workplace Cycle Challenges work www.challengeforchange.com