Download
1 / 18
210 likes | 517 Views
Marine Habitat Mapping, Applications for Fisheries Management. Jens Kruger SPC’s Division of Applied Science and Technology CEAFM workshop, December 2010. Why map benthic habitats?. Seafloor habitat mapping provides fundamental baseline information for decision-makers working in all sectors:

E N D
Marine Habitat Mapping,Applications for Fisheries Management Jens Kruger SPC’s Division of Applied Science and Technology CEAFM workshop, December 2010
Why map benthic habitats? Seafloor habitat mapping provides fundamental baseline information for decision-makers working in all sectors: • Fisheries assessments • Environmental impact statements • Decision to approve extractive/other use • State of Environment reporting (inventory of assets) • Design of marine reserves
Uses of habitat maps(under different guises) Fisheries (fish habitat for stock assessment) Navigation (reef, sandbank, bank, shoal etc.) Aggregate extraction (resource assessment) Deep sea minerals lease assessment Ports and harbours (channels, intertidal, shoals) Infrastructure (cables, pipelines, etc.) Defence (mine countermeasures, acoustics) Spatial management (eg. MPAs)
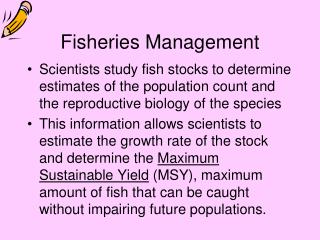
What is a habitat map? Map of the biophysical environment that shows where particular benthic species or communities occur (or are likely to occur) Based on geomorphology, oceanography, primary production, depth, sediment type, seafloor roughness, etc. Habitat maps can be derived from any one or all of these variables WITH information on benthic communities
Aitutaki, Cook IslandsImpacts of coastal development on the lagoon ecosystem CHANNEL Proposed capital dredging: • Attract yacht tourism ($60,000/year) • Deepen & widen shipping channel for navigation • Improve port facilities Baseline Data Needs: • Marine Habitats • Bathymetry • Hydrodynamics
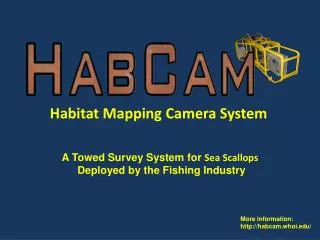
Methods: Habitat Mapping GPS GPS towed by diver with camera camera GPS line camera slate drybag floats & weight
Satellite imagery Methods: Bathymetry and Oceanography multibeam echosounder Multibeam Current Meter RTK GPS MBES Tide Gauge GPS Singlebeam SBES fringing reef rim reef lagoon NEARSHORE
Marine Habitat Map of Aitutaki, … as well as bathymetry and computer model Bathymetry Map Numerical Hydrodynamic Model
Potential Habitat Map of Majuro Lagoon(no ground truthing & not detailed) Sediment covered outcrops/subcrops Flat fine to medium sand Sediment aprons Land Areas dominated with Halimeda mounds Coral heads
Bathymetry Mapping Official Marine Chart of Niutao, Tuvalu
Bathymetry Map of Efate, Vanuatu • 20 years of ship sounding data were merged with high-resolution nearshore multibeam data to compile a 50 m Digital Terrain Model Data Sources DTM of Efate
Bathymetry of Efate, Vanuatu 3D perspective view of Efate. 4x vertical exaggeration
Bathymetry Map of Samoa 3D perspective view of Upolu and Savai’i
Growing Map and Spatial Data Repositoryhttp://geonetwork.sopac.org 2011: Marine surveys in Tongatapu, TO; Mangaia, CK; Rangiroa, FP
Application to Fisheries Management Bonefish Fishery Management Plan for Aitutaki • Catch and Release Fishing in Aitutaki: Sport Fishing Workshop 16-23 June, SPC & MMR • Bathymetry and habitat maps used to identify areas suitable for bonefish fly-fishing Fish Aggregation Devices • Focus on food-security & climate change adaptation • Recent deployments in Kiribati, Samoa, Marshall Islands, Nauru • Planned deployments in Solomon Islands and Tuvalu
Marine Habitat Mapping and Numerical Modellingan underutilised tool for fisheries and marine ecosystem management in PICTs • Funafuti, Tuvalu. Data holdings include bathymetry, water elevation, wave and current velocities, seismic subbottom profiles, sediment samples, satellite imagery, computer model, etc. , etc. Collective wealth of information forms the basis for management tools Previously limited understanding