Download
1 / 23
310 likes | 591 Views
Univariate Linear Regression . Chapters Eight, Nineteen, Twenty and Twenty One Chapter Eight Basic Problem Definition of Scatterplots What to check for . Basic Empirical Situation. Unit of data. Two interval (or ratio) scales measured for each unit.

E N D
Univariate Linear Regression • Chapters Eight, Nineteen, Twenty and Twenty One • Chapter Eight • Basic Problem • Definition of Scatterplots • What to check for
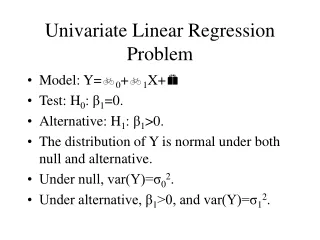
Basic Empirical Situation • Unit of data. • Two interval (or ratio) scales measured for each unit. • Example: observational study, independent variable is score of student on first exam in AMS315, dependent variable is score on final exam. • Objective is to assess the strength of the association between score on first exam and final.
Scatterplot • Horizontal axis: independent variable • Vertical axis: dependent variable • One point for each unit of data. • Draw by hand or use computer • graphs, scatterplot
Examining the scatterplot • Regression techniques ASSUME • 1. Linear regression function • 2. Independent errors of measurement • 3. Constant error variance • 4. Normal distribution of errors. • If assumptions 1 and 3 met, scatterplot is a football shaped cloud of points.
How Assumptions Relate to Scatterplot • Linear regression function: can describe the cloud of points by laying a pencil through the graph. • Independence of errors of measurement: not obviously detectable in scatterplot. • Constant error variance: if violated, there is a “horn” shape to the scatterplot. • Normality: also not easily detectable in scatterplot.
SPSS options with scatterplots • Can label cases • Can title plots • Can edit plots • Can use “control variables” • Can use “sunflowers” to represent multiple points • Can have a matrix of scatterplots • Can overlay plots
Special fitting algorithm: LOWESS Smooths • Locally weighted scatterplot smoothing. • If assumption of linear regression is approximately correct, the lowess smooth will be a nearly straight line.
Three dimensional plots • Can get simple three dimensional plots • Can rotate plots
How to use a scatterplot • Look at it! • Check whether linear regression function appears reasonable (pencil test). • Check whether there is a “horn” shaped pattern in the scatterplot (homoscedasticity violated). • Check for outliers or other unusual patterns.
Example Problem Set • I used the scatterplot facilities to plot the score on the final examination against the score of the first examination. The output is displayed below. Use it to answer the following questions.
Example Problems • Does there appear to be a linear relation between score on first examination and score on final examination? • What is the assumption of homoscedasticity and does it appear to hold for this data? • Are there outliers or other unusual patterns?
Chapter Nineteen: Linear Regression and Correlation • Ordinary Least Squares (OLS) regression line. • Basic formula for OLS line. • Definition of fitted (predicted) value and residual.
Fitting Lines • By eye • By formula • want best equation for a line. • A line is specified by a slope and intercept: y=a+bx • a is intercept • b is slope
Ordinary Least Squares Line • Residual • ASSUME intercept is a and slope b • ASSUME dependent variable value is y1 and independent variable value is x1 • Residual r1(a,b)=(y1-a-bx1) • Chose slope b and intercept a so that the sum of the residuals squared is as small as possible.
Sum of Squared Residuals • Definition of SS(a,b)
Problem • Choose a and b so that SS(a,b) is as small as possible. • This is always possible • The optimal choices of a and b are the OLS estimates of the parameters of the line. • The fitted regression line is
Finding OLS Estimates • Differentiate SS(a,b) with respect to a and b. • Set derivatives equal to zero. • Solve resulting set of equations.
OLS Estimate for the Slope • The solution is always the same; you should memorize the following.
OLS Estimate of the Slope • The correlation coefficient is r. • The standard deviation of the y data is sY. • The standard deviation of the x data is sX • There are other formulas as well that are useful for solving specific distributional problems
Point Slope Form of the Regression Line • Memorize the following formula:
Calculating Predicted Values and Residuals • The computer output gives you an estimated slope and estimated intercept. • Use that to find the predicted value. • The residual is the observed minus predicted value.
Determining how well the line fits • The correlation coefficient r is a measure of association. • The value of r2 is the fraction of variance explained by the regression. • The value of (1- r2) is the amount of variance that is not explained by the regression.
Coming up next • Material of Chapter 20, formal tests of hypotheses • Examples for past exams.