Download
1 / 87
920 likes | 1.22k Views
Linkage and Association. John P. Rice, Ph.D. Washington University School of Medicine. Outline. Linkage Linkage Disequilibrium Haplotypes History of GWAS dbGaP Methods Genomic Inflation Factor False Discovery Rate Ethnic Stratification QQ-Plots. Definition of centimorgan (cM).

E N D
Linkage and Association John P. Rice, Ph.D. Washington University School of Medicine
Outline • Linkage • Linkage Disequilibrium • Haplotypes • History of GWAS • dbGaP • Methods • Genomic Inflation Factor • False Discovery Rate • Ethnic Stratification • QQ-Plots
Genome Arithmetic • Kb=1,000 bases; Mb=1,000Kb • 3.3 billion base pairs; 3,300 cM in genome 3,300,000,000/3,300 = 1 Mb/cM • 33,000 genes 33,000/3,300 Mb = 10 genes / Mb • Thus, 20 cM region may have 200 genes to examine • Erratum – closer to 20,000 genes in humans
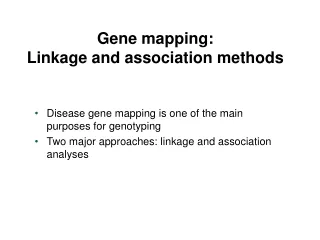
Linkage Vs. Association • Linkage: -Disease travels with marker within families -No association within individuals -Signals for complex traits are wide (20MB) • Association: -Can use case/control or case/parents design -Only works if association in the population -Allelic heterogeneity (eg, BRAC1) a problem • Linkage – large scale; Association fine scale (<200kb)
LOD Score • LOD score is log10 (odds for linkage/odds for no linkage) Traditional (1955) cut-off is LOD=3 (linkage 1000 times more likely) • A LOD of 3 corresponds to α = 0.0001 • Lander and Kruglyak (1995) A LOD score cut-off of 3.6 for a genome screen using an infinitely dense map corresponds to a “genome-wide significance of 0.05” • This is the criteria often cited today
Bipolar Disorder • Lifetime prevalence of BP1 ≈ 1%, BPII ≈ 0.5% • Risk of suicide 10 – 15% • Treatment not curative, treatments not completely effective in mitigating symptoms • Heritability estimates ≈ 80% • Linkage reports for ½ the chromosomes, with a lack of replication • Lack of power in original reports?
Significant and Suggestive Linkage • Given density of markers, significant linkage is LOD > 3.03 • Suggestive linkage is LOD > 1.75 • These take into account that 2 genome screens were analyzed (narrow and broad) • Significant – Occurs once in twenty genome screens Suggestive – Occurs once in a genome screen
Linkage Analysis (Summary) • Approximately 2,000 “independent “ tests with an infinitely dense genetic map (Multiple testing a much bigger problem in GWAS) • Linkage studies have been unsuccessful for complex diseases • May be useful as input into GWAS analysis? • Today – GWAS (using SNP chips) have taken over • My opinion – pursue chromosomes 6 and 8, even if not genome-wide significant in GWAS
Genome-Wide Association Studies (GWAS) • Chips by Illumina and Affymetrix genotype 1 million SNPs (Single Nucleotide Polymorphisms) as well as CNVs (Copy Number Variations) • Affordable on a large scale • Capitalize on Linkage Disequilibrium between the markers and variation at a susceptibility gene
Disequilibrium Let P(A1)=p1 Let P(B1)=q1 Let P(A1B 1)=h11 No association if h11=p1q1 D = h11-p1q1
Population Stratification Population 1 Population 2 Odds ratio = 1 Odds ratio = 1 Combined Population Odds ratio = 2.38
D´ and r² D tends to take on small values and depends on marginal gene frequencies D = D / max(D) r² = D² / (p1p2 q1q2) = square of usual correlation coefficient () Note: r2 = 0 D = 0 D = ±1 if one cell is zero (eg, no recombination) r² can be small even when D = ±1 Prediction of one SNP by another depends on r²
Haplotypes • We measure genotypes • A double heterozygote is ambiguous • Must estimate haplotype frequencies from genotype frequencies – usually assume random mating and use EM algorithm • The program haploview is commonly used to estimate and depict LD
Different Haplotypes; same genotypes A1 A2 B1 B2 • Haplotypes A1 B1, A2 B2; A1 B2, A2 B1 • Independence hij = pi qj • Positive Association hij > pi qj • Negative Association hij < pi qj
Blocks and Bins • Predictability of one SNP by another best described by r2 – basic statistics • Block – set of SNPs with all pair-wise LD high (usually defined in terms of D) • If one uses r2 – insert a SNP with low frequency in between SNPs with freqs close to 0.5, then block breaks up! • Perlegen (Hinds et al, Science, 2005) -– use bins where a tag SNP has r2 of 0.8 with all other SNPs. Bins may not be contiguous.
Summary (Blocks and Bins) • Blocks using D may have a “biological” interpretation (long stretches with |D | =1 and indicates no recombination) • Selection of Tag SNPs is a statistical issue, want to predict untyped SNPS from those that are typed – r2 is natural measure • Most current WGA studies use bins based on r2 (typically r2 > 0.8) • Sample size needed is N/ r2 with reduced r2
Analysis • Case/ control studies are common. Use logistic regression with case/control status as the dependent variable. Use SNP genotype as an independent variable with other covariates and test one SNP at a time • PLINK is my program of choice to do this • Family based studies are also used. TDT (case and both parents) designs are used in GWAS but less efficient
Testing Marker Effects log (odds) = + 1X1 odds = ee 1 X1 Genotype Odds 11 e 12 ee1 22 ee21 Test 1 = 0, all odds = e Note: No dominance effect
Testing Marker Effects log (odds) = + 1 X1 + 2 X2 odds = ee 1 X1 e 2 X2 Genotype Odds 1 1 e 1 2 e e1e2 2 2 ee21 Test 1= 2 = 0, all odds = e If 2 = 0, then have additive model
Haplotypes? • We may wish to consider more than one SNP at a time in the linear regression. • More information in a set of close SNPs • May wish to study a set of SNPs to see if one explains the case/control difference, i.e., does the evidence for one SNP disappear when controlling for other SNPs.
Haplotype Trend Analysis • Zaykin et al (2002) Hum Hered 53:79-91 • Use haplotypes in logistic regression • For a pair of SNPs, there are 4 haplotypes, so there will be 3 “dummy” variables • Assume pair of haplotypes in an individual are “additive”, so only need 3 regression coefficients • If haplotypes are known with certainty, then:
Estimated Haplotypes • One can get estimates of the haplotype probabilities for each individual (LD between SNPs OK) • Put the estimated probabilities into the logistic regression
GWAS Studies How do we keep up?
A Catalog of Published GWAS • www.genome.gov/26525384 • Number of Studies: • 2005 2 – Includes Age-related Macular Degeneration • 2006 8 • 2007 87 • 2008 70 (through July 27) • Bipolar Disorder: • 3 studies (1 used pooled genotypes) • No convincing signals
“History” of GWAS • Early studies used pooled designs – too expensive to do individual genotypes • Affymetrix and Illumina come out with affordable SNP chips • First study to generate enthusiasm – Age-related macular degeneration (Klein, 2007) found a “real” signal • Type II diabetes studies found “real” signals – linkage studies were problematic
Welcome Trust (WTCCC) Initiative • Common set of 3,000 controls • Several disorders (including Bipolar) with 2,000 cases each • Results in the public domain • Published in Nature in 2007
Major U.S. GWAS Initiatives • New NIH Policy – All NIH Funded GWAS studies must deposit individual genotypes and phenotypic data in dbGaP at NCBI • GAIN and GEI RFAs funded studies with existing DNA, subjects consented to allow data to go to dbGaP, and genotyping done at associated genotyping centers • New RFA from NIMH to collect very large (~10,000) samples
GAIN ProposalsGenetic Association Information Network • 6 WGA projects were selected across NIH • Projects: • Schizophrenia • Bipolar Disorder • Depression • ADHD • Psoriasis • Type 1 Diabetes (nephropathy) • Data at dbGap (1 year embargo on publication) • Note: 4/6 Mental Health related!!
Gene Environment Initiative (GEI) • 8 GWAS funded – oral cleft, addiction, coronary heart disease, lung cancer, type 2 diabetes, birth weight, dental caries, premature birth • Required existing DNA and subjects consented to share • Issued Supplement for replication samples • Addiction (Bierut) samples genotyped first – we got genotypes from CIDR in May; once cleaned, they go to dbGaP
Good News for Analysts • Cleaned data available goes to investigators who collected data at the same time as everyone else • It takes years to collect subjects • Cleaning GWAS data is hard and time consuming • Opportunity for combining data from multiple studies • Is this fair?
dbGaP • Genotype and Phenotype Database • Data made available to investigators and others at the same time – 1 year publication embargo • Request access using eRA Commons sign on – requires Institutional sign-off • Request must be approved by a DAC (data access committee)