Download
1 / 13
130 likes | 260 Views
Sloan Digital Sky Survey. Astronomy 007 13 April 2006 Margaret Flynn. Overview. “The most ambitious astronomical survery ever undertaken” 2.5m telescope based in New Mexico Ultimate results Digital images of more than 25% of sky 3-D map of 1,000,000 galaxies and quasars.

E N D
Sloan Digital Sky Survey Astronomy 007 13 April 2006 Margaret Flynn
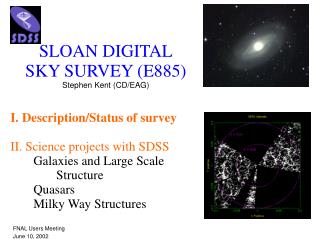
Overview • “The most ambitious astronomical survery ever undertaken” • 2.5m telescope based in New Mexico • Ultimate results • Digital images of more than 25% of sky • 3-D map of 1,000,000 galaxies and quasars
History of the Project • Begun in 2000 • Named for the Alfred P. Sloan Foundation, which funded the survey • Five data releases (EDR, DR1-4), each covering more area than the last
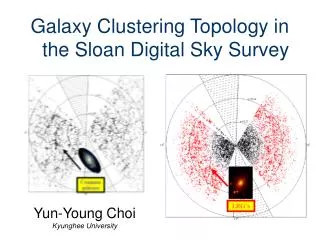
Why Map the Sky? • We must understand our current universe to reconstruct cosmic history • This is a difficult task because of the amount of dark matter • “By careful mapping of the positions and motions of galaxies” we can find clues about the amount and nature of dark matter • Observing galaxies and quasars at different distances, astronomers can see how their properties change with time
How Exactly is the Sky Surveyed? • SDDS is a redshift survey • Redshift distance • Obtains high-resolution photos in five different colors • Through filters u, g, r, i, and z
About the Telescope • Viewing area ≈ 30 full moons • Consists of 2 reflecting mirrors, 2 corrective lenses for focus • Photons hit the detectors, CCDs collect them • CCDs organized into rows, which record object’s brightness in different color
How the Telescope Works • Spectrograph analyses each celestial objects recorded • Astronomers drill holes corresponding to positions of bodies • Holes plugged with fibers • Capture light from the objects • Record results in CCDs
Spectrographs • Device to produce any spectrum • Turns wavelengths of light light from hundreds of galaxies and quasars into spectra at the same time • Produces this spectrum through a “grism” • Diffraction grating plus prism
The Observatory • Apache Point Observatory in Sunspot, NM • Houses the telescope, support facilities, dormitories • Altitude is conducive to astronomy • Little water vapor • Few contaminants
After the Images are Recorded… • Astronomers process the data to extract information about the properties of celestial bodies • Compared to the Yellow Pages • Importance of processing quickly • “Pipeline”—digital images star positions
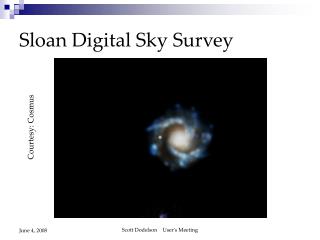
Some Results Thus Far… • Shows us how redshift can affect the way we see galaxies Sloan Digital Sky Survey The Early Data Release or EDR was released in June 2001 covering 462 square degrees and 53,000 spectra. Data Release 1 or DR1 was released in April 2003 covering 2,099 square degrees and 186,000 spectra. Data Release 2 or DR2 was released in March 2004 covering 3,324 square degrees and 367,000 spectra. Data Release 3 or DR3 was released September 27, 2004, and covers 4,188 square degrees and 528,640 spectra. [1] Date Release 4 or DR4 was released in June 2005 covering 6, 670 square degrees and nearly 850,000 spectra
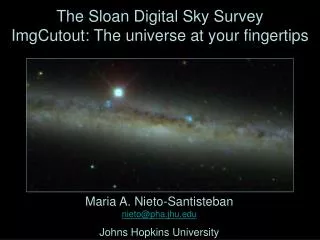
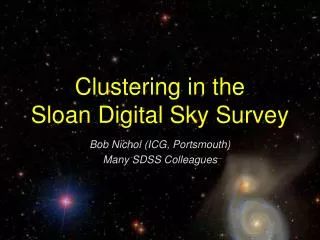
Images Recorded by SDDS A region of the constellation Cygnus Galaxy NGC3077 in Ursa Major The Coma cluster of galaxies Whirlpool pair of galaxies referred to as M51
Works Cited • “Sloan Digital Sky Survey.” 29 March 2006. Accessed April 11, 2006 <http://www.sdss.org/sdss.html>. Wikipedia, The Free Encyclopedia. Sloan Digital Sky Survey. 5 April 2006. Accessed 11 April 2006 <http://en.wikipedia.org/wiki/Sloan_Digital_Sky_Survey>.