Download
1 / 45
460 likes | 700 Views
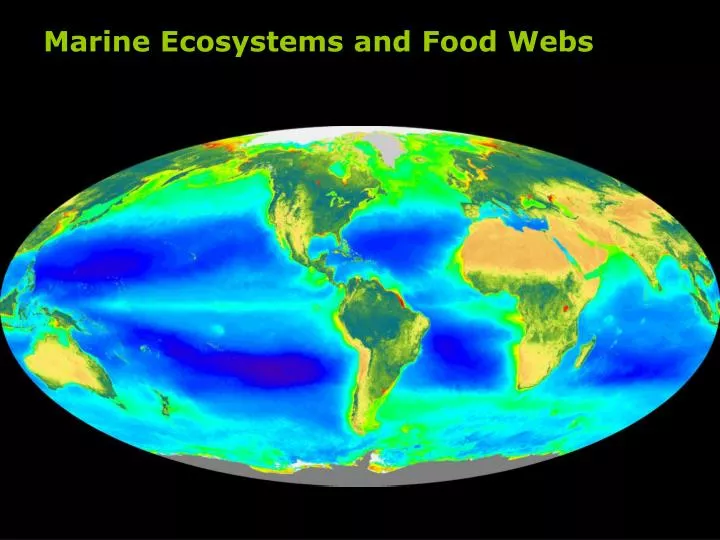
Marine Ecosystems and Food Webs. Carbon Cycle. Marine Biota. Export Production. Export Production of Organic Carbon. Ocean Ecosystem Structure. Trophic levels and dynamics. Ocean Ecosystem Structure. Trophic levels and dynamics. Ocean Ecosystem Structure. Trophic levels

E N D
Carbon Cycle Marine Biota Export Production
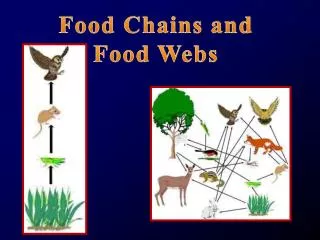
Ocean Ecosystem Structure Trophic levels and dynamics
Ocean Ecosystem Structure Trophic levels and dynamics
Ocean Ecosystem Structure Trophic levels and dynamics
Ocean Ecosystem Structure Trophic levels and dynamics
Ocean Ecosystem Structure Example of a more complex Food Web
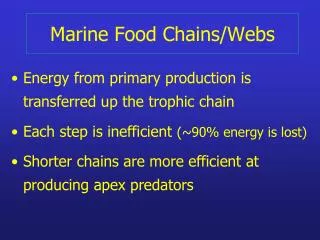
Ocean Ecosystem Structure Energy Transfer between Trophic Levels is not efficient
Trophic levels and dynamics Food Web Energy
How do we measure Biomass? Mass transfers are more easy to keep track than energy transfers
Large scale Eddies 200 km
Color sensor satellites: MODIS, SeaWiFS, MERIS, OCTS, and CZCS http://oceancolor.gsfc.nasa.gov/SeaWiFS
A useful way to keep track of biomass in the lower trophic levels is to follow the path of MACRONUTRIENTS Carbon C Nitrogen N Phosphorus P
Redfield Ratio C : N : P Atlantis in 1934 and today 106 : 16 : 1 Redfield A.C.,On the proportions of organic derivations in seawater and their relation to the composition of plankton. In James Johnson Memorial Volume. (ed. R.J. Daniel). University Press of Liverpool, pp. 177-192, 1934. This works stems from his participation as a physiologist in the voyages of WHOI's first research vessel Atlantis.
C : N : P source 1) atmosphere source 1) from N2 atmosphere gas2) ocean subsurface3) remineralization of dead organic matter 4) biological (e.g. excretions) source 1) not biological, not atmospheric2) fluvial At large Nitrogen appears to be the limiting factorin ocean productivity in today’s oceans
What is the explanation for the Redfield ratio? • Redfield (1958) “biological control of chemical factors" in the ocean: living organisms in the ocean evolved to have a N:P ratios of about 16 → when N is not limiting then N and P but also C and O interact to produce this relation. • Very stable in deep ocean • Not so stable between phytoplankton species. • Perhaps only general average?
N=nitrogen P=phytoplank. Z=zooplank. D=detritus Simple Nitrogen Model Net Primary Production (NPP) ~45 Pg C/yr hn NPP P ~1 Pg C (0.2 % of photosynthetic biomass) N S(No-N) D Z Phytoplankton biomass turns over in about a week!
Description of the oceanic ecosystem based on Nitrogen exchanges Fixation N2 Nitrification Mineralization NH4 NO3 Uptake Phytoplankton Grazing Mix Layer depth Chlorophyll Zooplankton Mortality Large detritus Water column Susp. particles Nitrification N2 NH4 NO3 Denitrification Aerobic mineralization Organic matter Sediment
Carbon Cycle Marine Biota 45 GIC/yr Export Production
What are the controls on Primary Production? • Ocean Circulation (e.g. gyres, coastal upwelling, eddy fluxes) modulates the fluxes of essential nutrients • Ocean nutrient inventory • Utilization of nutrients in HNLC (High Nutrients Low Chlorophyll regions) • Changes in Redfield Ratio
What are the controls on Primary Production? • Ocean Circulation (e.g. gyres, coastal upwelling, eddy fluxes) modulates the fluxes of essential nutrients • Ocean nutrient inventory • Utilization of nutrients in HNLC (High Nutrients Low Chlorophyll regions) • Changes in Redfield Ratio
What are the controls on Primary Production? Nutrient Sources for Primary Production The flux of organic carbon must be sustained by an adequate flux of macronutrients If macronutrients are unavailable then primary production is reduced!
Surface CHL-A 1) Central Gyres 2) Upwelling Regions
Phytoplankton Blooms and Physical Environment Bands of the dionflagellate Lingulodinium polyedrum moving onshore over the troughs of a series of internal waves
Nonlinear Internal Waves and Phytoplankton Isopycnals
What are the controls on Primary Production? • Ocean Circulation (e.g. gyres, coastal upwelling, eddy fluxes) modulates the fluxes of essential nutrients • Ocean nutrient inventory • Utilization of nutrients in HNLC (High Nutrients Low Chlorophyll regions) • Changes in Redfield Ratio
What are the controls on Primary Production? Nitrogen appears to be the limiting factor for growth in modern time. • Ocean Circulation (e.g. gyres, coastal upwelling, eddy fluxes) modulates the fluxes of essential nutrients • Ocean nutrient inventory C : N : P 106 : 16 : 1
Modern TIME N2 fixation Denitrification N = 25790 N* = N – 16 P (Gruber & Sarmiento 1997)
What are the controls on Primary Production? • Ocean Circulation (e.g. gyres, coastal upwelling, eddy fluxes) modulates the fluxes of essential nutrients • Ocean nutrient inventory • Utilization of nutrients in HNLC (High Nutrients Low Chlorophyll regions) • Changes in Redfield Ratio
Southern Ocean HNLC Map of annual average nitrate concentrations in the surface waters of the oceans. Data from Levitus, World Ocean Atlas, 1994.
What are the controls on Primary Production? • Ocean Circulation (e.g. gyres, coastal upwelling, eddy fluxes) modulates the fluxes of essential nutrients • Ocean nutrient inventory • Utilization of nutrients in HNLC (High Nutrients Low Chlorophyll regions) • Changes in Redfield Ratio
What are the controls on Primary Production? • Ocean Circulation (e.g. gyres, coastal upwelling, eddy fluxes) modulates the fluxes of essential nutrients • Ocean nutrient inventory • Utilization of nutrients in HNLC (High Nutrients Low Chlorophyll regions) • Changes in Redfield Ratio Climate Variability and Change