Download
1 / 58
580 likes | 743 Views
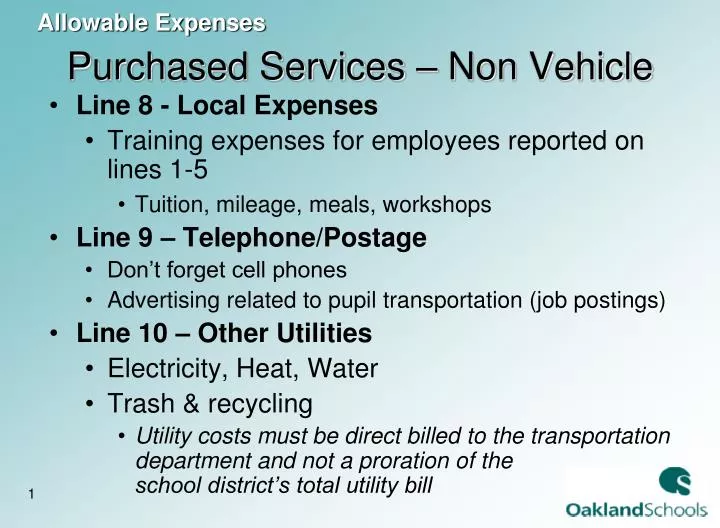
Allowable Expenses. Purchased Services – Non Vehicle. Line 8 - Local Expenses Training expenses for employees reported on lines 1-5 Tuition, mileage, meals, workshops Line 9 – Telephone/Postage Don’t forget cell phones Advertising related to pupil transportation (job postings)

E N D
Allowable Expenses Purchased Services – Non Vehicle • Line 8 - Local Expenses • Training expenses for employees reported on lines 1-5 • Tuition, mileage, meals, workshops • Line 9 – Telephone/Postage • Don’t forget cell phones • Advertising related to pupil transportation (job postings) • Line 10 – Other Utilities • Electricity, Heat, Water • Trash & recycling • Utility costs must be direct billed to the transportation department and not a proration of the school district’s total utility bill
Allowable Expenses Purchased Services • Line 11 – Purchased Services – Staff • The number and costs of staff contracted from a third party entity who if employed by local district would have been reported on lines 2 – 5 including: • Bus Drivers • Aides • Secretaries, clerical • Other support staff (A Third Party Entity is not another Michigan School District or Intermediate School District)
Allowable Expenses Purchased Services – Non Vehicle • Line 12 – Other Non-Vehicle Purchased ServicesCopier leases, printer, fax repairs • Technology support • Routing or software • Advertising for employee recruitment • Maps – generation and printing • Garage or parking lot repairs • Performed by other departments • Outside contractors • Equipment repair • Fuel pumps, time clocks, bus wash
Allowable Expenses Purchased Services – Non Vehicle Line 12 continued • Repairs for private residences – mailboxes • Snow plowing - in house or contracted • Laundry – mechanics uniforms, towels • Pest control • Contracted aides, secretarial or dispatcher • Rental of in-service materials • Driver Physicals • Do not include improvements made to bus garages and bus parking lots
Allowable Expenses Contracting or leasingwhere does it go? • Line 11: Any person performing transportation duties not employed by the school district • including drivers, mechanics, bus aides • Line 15: Both black and yellow buses and staff not employed or owned by the district • Line 19: Black and yellow buses not owned by the school district • when staff is employed by district, or • if staff and buses are provided by separate companies
Allowable Expenses Non Black and Yellow • Line 14 – Pupil Transportation Common Carrier • Amount paid to a third party entity offering services to the general public • Includes public transit and companies • Passes for public transportation • Must include the number of vehicles the company uses to provide the service • These vehicles are not listed on the SE-4107 • Only exclusive special ed common carrier costs may be charged to Section 52 or 53a • Field trip costs must be reported as regular education Column 2 • Does not include companies such as Dean, First Student or Durham
Line 15 – Pupil Transportation Common Carrier Amount paid to a third party entity to provide pupil transportation to and from school Includes Servicar, First Student, Dean, Durham Include the number of vehicles the company uses to provide the service These vehicles MUST BE listed on the SE-4107 Only exclusive special ed costs may be charged to Section 52 or 53a Field trip costs must be reported under regular education Column 2 If contracting bus drivers only – report on Line 11 Black and Yellow Allowable Expenses
Allowable Expenses Purchased Services – Vehicle Related Line 16 – Family Vehicle • Private vehicle • Parents • Pupils transporting themselves • Only exclusive special ed costs may be charged to Section 52 or 53a • Do not include transportation for a school related event
Allowable Expenses Purchased Services – Vehicle Related • Line 17 – Pupil Transportation Taxi Cab • Amount paid to taxi cab companies for transporting pupils to and from school • Must include the number of vehicles the company uses to provide the service • Taxis are not listed on the SE-4107 • Only taxi cab costs exclusively for special education riders may be charged to Section 52 and Section 53a
Allowable Expenses Purchased Services – Vehicle Related Line 18 – Fleet Insurance • Vehicles used to transport students to school and school related events • Report by vehicle • Prorate premiums for vehicles not used exclusively for student transportation • Not eligible to be prorated to Section 53a • Combination vehicles are reported in Column 2 • Spare buses – 1 for every 10 • Must match current year’s SE-4107
Allowable Expenses Contracted or Leased Buses • Line 19 • Amount paid to lease or contract buses to provide pupil transportation to and from an instructional site • Driven by school district staff • Black and yellow only • Not eligible to be prorated to Section 53a • Include the number of vehicles • Maintenance, repair, fuel, etc. are not included • Vehicles must be reported on the SE--4107
Allowable Expenses Purchased Services – Vehicle Related Line 20 – Other Vehicle Related Costs • Costs for maintenance and repairs for buses listed on line 16 • Not eligible to be prorated to Section 53a • Contracted vehicle repairs • Two-way radios • Contracted or district owned buses • GPS monthly fees • Fire extinguisher inspections • Towing
Allowable Expenses Supplies • Line 22 – Gasoline/Fuel • Tax is not included • Line 23 – Oil & Grease • Line 24 – Tires and Batteries • Only vehicles used for pupil transportation • Prorated based on % of buses • If direct cost – documentation to MDE
Allowable Expenses Supplies • Line 25 – Other Supplies, Repair Parts • Small tools • Anti-freeze, brake wash, deicer • Cleaning materials used for buses • Bus repair parts • Emergency equipment, fuses, clean up kits, fire extinguishers • Repair parts for garage equipment • Line 26 Office Supplies • Supplies used to support the operation of the pupil transportation office
Allowable Expenses Other Expenses • Line 28 Other Expense/Adjustment • Driver certification fees • Licensing costs • Road tests • Driver awards • Toll and ferry fees • Subscriptions • Driver jackets • Willalso be used by MDE to make any necessary adjustments
Allowable Expenses Bus Amortization • Authorized annual amount as calculated on the SE-4107 • Reported on line 29 • Not eligible to be prorated to Section 53a • The amount must agree with final SE-4107 • Do not report spare bus amortization
Allowable Expenses Bus Amortization • Amortization for vehicles may not be reported on the Transportation Expenditure Report until calculated on the final SE-4107 School Bus Inventory Report • New vehicles added to the SE-4107 in 2013-2014 will not have amortization calculated until the 2014-2015 school year
Allowable Expenses Bus Amortization Amounts found on your district’s Final SE-4107
Only numbers allowed to be reported on Line 29 Allowable Expenses Bus Amortization
Reported on Line 29 Column 2 Reported in Column 3 Allowable Expenses Bus Amortization
Must be reported in column 2 Allowable Expenses Combination Buses
Are not reported on Line 29 Allowable Expenses Spare Buses
Allowable Expenses District Totals • Line 31 - Total Annual Miles • Total miles traveled by fleet vehicles used in providing pupil transportation to instructional sites • Line 32 – Total Riders Per Count Week • Taken from Special Ed and Regular Ed Count Week Logs • Line 33 – Total Fuel Consumed • Total number of gallons of fuel used by pupil transportation fleet vehicles for providing pupil transportation
Allowable Expenses Common Mistakes to Avoid Failure to communicate and coordinate with the Transportation Department in completing the reports Failure to communicate and coordinate with the Special Education Director on all transportation issues
Allowable Expenses Be Prepared Throughout the Year: • Track you fuel and grease costs & usage • Maintain driver hours lists • Vehicle purchases and trade ins/sales • Track facility and parking lot repairs
Putting it All Together How can reported costs help me evaluate my operation? Keep in Mind: Quality results are only as accurate and complete as the quality of the source data Ultimate Goal - Optimal Operational Performance
Analyzing Your Data SE-4094 Template & Data Summary available upon request
Analyzing Your Data On Time, Ready to Learn at What Cost? • Financial Constraints and Legislative changes may prevent us from doing what we want for student safety • Target fixation may get us through the day to day - but may cause us to miss strategic thinking • Are you taking the time to analyze your costs?
The True Cost of Transportation Your SE-4094 may not accurately provide a true look of your district’s actual transportation costs Are you reporting true: Mileage? Student Counts? Are all costs in your transportation budget? Human resources Technology Maintenance Is work on non-transportation equipment included in transportation budget? Analyzing Your Data
Analyzing Your Data Service Delivery Affects Costs • Different approaches to providing pupil transportation are found in many school districts. • Quantitative metrics will not provide the accurate measure of performance - without a thorough understanding of how the various approaches to service delivery will affect the comparison
Analyzing Your Data Analyze Your Performance • Compare your data to district fleets of similar size and student counts • Use the measures to ask questions about how you do business and why some measures may be higher or lower than comparative districts • Identify how changing your practices can have an impact on your results • Use historical trend information to establish goals and objectives for changes • http://www.michigan.gov/cepi/0,1607,7-113-21423_35782_49719---,00.html
Analyzing Your Data Changes • Identify what elements will need to be changed • Identify a reasonable time frame for the change • Establish timelines for completing goals and objectives • Assign responsibility and accountability to specific personnel • Measure, recalculate and reevaluate the changes impact on your operation • Were they positive? • Were they as expected?
Performance Indicators Transportation costs are affected by district operational requirements and constraints Some of those costs can be quantified, but others are subjective – such as extra accommodations for special education students beyond those required for transportation Use of the following performance indicators will provide another way to analyze your operations Analyzing Your Data
Analyzing Your Data Cost Per Student Total Annual Cost ÷ Students Transported • Single most important measure of operational efficiency • Objective is to move the maximum number of students with as few resources as possible
Analyzing Your Data Cost Per Student • Regular Ed Cost Comparisons: • State Average - $684* • 2011-12 – State Average - $749 • Special Ed Cost Comparisons: • State Average - $5,982* • 2011-12 – State Average - $6,607 *source MSBO Student Transportation Benchmarking Survey July 2013 (2010-11 4094)
Analyzing Your Data Cost Per Bus Total Annual Cost ÷ # of Insured Buses • Used as a means of comparison for commercial transportation service providers* • Most RFP’s and contracts based on cost of bus per day* State Average - $52,829* Estimated 2011-12 - $49,920 *source MSBO Student Transportation Benchmarking Survey July 2013 (2010-11 4094)
Allowable Expenses Bus Maintenance Costs • Analyze the cost benefit for your district • When does replacement make the most sense?
Allowable Expenses Replace or Maintain? • Cannot predict future needed repair costs • The older the bus the greater the parts and maintenance costs • Lease or purchase will allow for: • Predictable line item fixed cost • Planned replacement rotation • “Soft” costs • Student and staff safety • Reliability
Allowable Expenses Maximize Efficiency Transportation efficiency is achieved by: • Maximizing # times bus is used each day • Buses Per 100 Students • Maximizing use of available seats • Bus Capacity Utilization
Maximize Efficiency Buses Per 100 Students Transported Total Reg. Ed Buses ÷ (Reg. Ed Students ÷ 100) Efficiency is achieved when the greatest number of students are transported by the fewest buses Demonstrates routing efficiency: • How well buses are being filled • How multiple trips/tiers are assigned to buses
Maximize Efficiency Buses Per 100 Students Transported 1.0 – 1.25 buses or less indicates effective capacity utilization and asset reuse* State Average 1.72* By Region: Upper Peninsula = 1.8 Northern Lower Peninsula = 2.1 Western = 1.7 Thumb and surrounding area = 1.6 South Central = 1.5 Southeast = 1.6 *source MSBO Student Transportation Benchmarking Survey November 2013
Maximize Efficiency Bus Capacity Utilization Assigned Riders ÷ Planned Bus Capacity • Reflects “fill it” principle • District procedures for have major impact • Time and distance effect • Performance guideline is 70 - 85%
Maximize Efficiency Simple Bus Capacity Utilization Total Riders ÷ Total # of Available Bus Seats • Indicates the ability to fully utilize available seats • A value >100% represents some degree of multiple tiering 65 passenger x 29 buses = 1885 seats 2431 students ÷ 1885 = 129 % utilization
Maximize Efficiency Planned Capacity Utilization Total Buses x Planned Seating • Alternative indication of the ability to fully utilize available seats • More relevant than simple capacity utilization because this value includes the seats "lost" due to policy decisions that limit seating capacity
Maximize Efficiency Runs Per Bus Total # of Bus Runs ÷ Total # of Buses Bell Times Factor: • If all schools start at the same time • The maximum number runs per bus = 2 • If school (high, middle, elem.) times are staggered • The maximum number of runs per bus = 6 “Reusing a bus through the day is a critical element of overall efficiency and cost effectiveness” * *source MSBO Student Transportation Benchmarking Survey July 2007
Maximize Efficiency Factors That Affect Efficiency • School Bell Times Adequate time between school times • Length of Bus Runs Long runs prohibit tiering • Geography/Distance • District Policies Walk to stop distance Students per seat Student ride time
Your Practices and Efficiency Use of Routing Software Use increases seating capacity Use your resources wisely Mechanics $35 - $45 hr w/benefits Are they on parts runs? Fixing mailboxes? Manage their time – will not get time back when not wrenching Rethink how you do maintenance Can a lower wage person do: Oil changes? seat repairs? Maximize Efficiency
Maximize Efficiency Practices to Consider • Participate in county wide bids to increase buying power • Parts, Tires, Fuel, Physicals and Drug Testing • Eliminate costly outside contractor costs • Use of fleet maintenance software • Standardization of vehicle maintenance • Data tracking, better fleet analysis • Better utilization of mechanic hours • Less vehicle down time • Fewer unexpected breakdowns • Fewer spare vehicles will be required
Maximize Efficiency Evaluate Regularly Audit your student ridership throughout the school year • Count often – every 5 to 6 weeks • Alternate your days to count • Monday 1st cycle, Tuesday next cycle, etc. • Count morning and afternoon • The calendar affects ridership • Eligible riders vs. actual riders