Download

1 / 34
340 likes | 388 Views
This study provides an overview of low birth weight (LBW) prevalence and implications in India, focusing on epidemiological data, growth trends, and developmental outcomes. It discusses the variations in LBW prevalence within the country, factors contributing to LBW, and the impact on long-term growth and adult health. The text also touches on interventions and public health issues related to LBW, emphasizing the need for sustainable approaches to address this crucial health concern.

E N D
Low Birth Weight: The Indian Perspective Prof. H.P.S. Sachdev
DEFINITIONS • WHO (1995) - Based on Global DataPerinatal & Neonatal Morbidity & Mortality Later Growth & Development • LBW - Below 2500 g VLBW - Below 1500 g • Birth weight crude proxy for fetal growth Only measure in Developing Countries • Focus – Optimal fetal development
Global LBW Prevalence (%) Asia 21 Oceania 20 Africa 15 Latin America 11 North America 7 USSR 7 Europe 6 Global 17
Presentation Format • Implications • Epidemiology • Time Comparison • Body Composition • Some Interventions • Public Health Issues
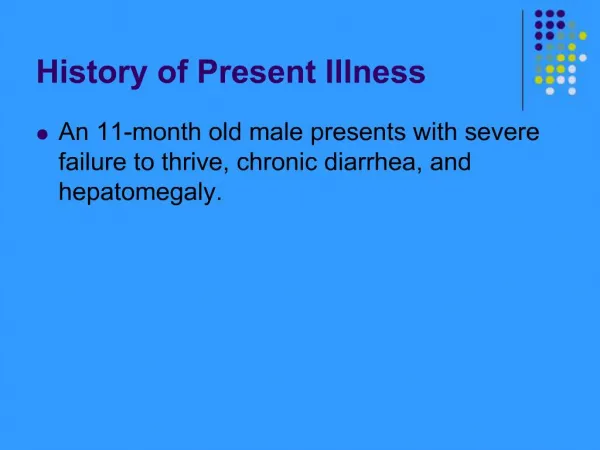
Implications of LBW • Morbidity and Mortality • Subsequent Development • Long term Growth • Adult Degenerative Diseases
Growth in Weight in Delhi LBW Boys Source: Indian Pediatrics 1995; 32: 963
Variation in LBW Prevalence • Inter Regional • Socio-economic • Urban Rural Varies from 10% to 56% Preterms 7.1% to 22.3%
Multicentric Data • National Neonatology Forum (1995/ 2002) Institutional Data on 37082 / 66512 Births LBW - 33% /31.6% VLBW - 3.3% /3.3% Preterm - 12.3% /14.7% • ? Overestimates: Underprivileged and High Risk Population
Multicentric and Other Data • CSSM (1995): 14 District Based Data on 27069 Births - 18.4%, Reliability ?? 2.7% - MP, 5.1%-AS, 25%-TN, 40%-OR • National Family Health Survey(99): 23% (Newborn Weight Recorded in 30% of 32,393 Births; Based on Recall: Bias) • Community surveys 8% - 19%
Type: Heterogeneous Population • Born Too Small (Intrauterine Growth Retarded or SFD; <2SD) OR • Born Too Soon (Preterm <37 Weeks)
LBW Type • NNF Data • Predominantly Term IUGR • Contrast: Developed Overwhelming Preterm
Gestational Distribution • Preterms India 7.1% to 22.3% (12.3%) Developed - 5% • At 36 weeks births 2% (West) vs 3-12% • Maximum Deliveries 40-41 W vs 39-40W • Variation (Socio-economic)
Trends in Low Birth Weight Mean Gest ? 0.8W 0.3W 0 0.7W 20-15% 14-10% Preterm 21-16% 74g Mean Wt 78g 52g 126g ? 1988 1962 1969 1969-73 1986 1989-93 1995 1994
Male Subscapular Trend mm P<0.01 Gestation (Weeks)
Positive Trend in Birth Weight • Improvement possible in current scenario • Both intrauterine growth and gestation contributory
Birth Weight Changes in Developed • Change in BW Comparable (33-100 g) But Prevalence Less • Persistence in Differences Racial Inter-country (ICE Multi-centric)
Early Life Origin of Diabetes F A T N E S S Bhargava, Sachdev, et al. N Engl J Med 2004;350:865-75.
Birth Weight and Infant Fat r=0.62; r2=0.38; p<0.001
Adolescent Pregnancy Mean Marriage Age (Yr) • Indirect Influence Wt, Ht & Nutrition • In U.P. LBW- 67% Preterm - 33%
Results of Systematic Reviews on Macronutrient Supplementation & BW
Food Supplement Consumption ICDS Data Source: Nayar et al. Indian Pediatrics 1997
Results of Systematic Reviews on Micronutrient Supplementation and BW
Does “One Birth Size Fit All” ? • Realistic Prevalence & Time Trends • Surveillance: NNF, Surveys, Sentinel, ICDS • Mix Sustainable Interventions vs Isolated • Body Composition esp. Interven Studies • Predominantly Growth Retarded: Requirements in Exclusively Breast Fed