Download
1 / 21
220 likes | 373 Views
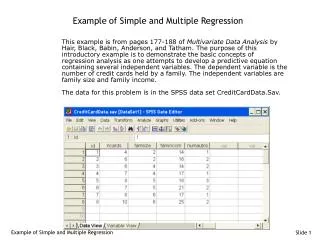
Simple & Multiple Regression. 1. 1: Simple Regression - Prediction models. r = .81. ?. ?. ?. 68. Let’s take our scatterplot as a start…. 1. Suppose we wanted to predict the weight of a person who was 68in tall?. Regression techniques allow us to do this.

E N D
Simple & Multiple Regression 1 1: Simple Regression - Prediction models
r = .81 ? ? ? 68 Let’s take our scatterplot as a start… 1 Suppose we wanted to predict the weight of a person who was 68in tall? Regression techniques allow us to do this
We use a method of least squares estimation (cue statistical hocus pocus music)… 1 2 r = .81 And we generate a line through the data so that all deviations (vertical) between the line and the data points are minimized
r = .81 …brings a change in weight… SLOPE A change in height… -234 And it will have a value on the y-axis for the zero value of the x-axis INTERCEPT This line will have a certain slope… 1 2 3
-234lbs The intercept can be seen more clearly if we redraw the graph with appropriate axes… 2 1
Using regression to make predictions… 1 3 r = .81 4 135lbs 2 68 From the line, we can predict that an increase in height of 1 inch should be accompanied by a rise in weight of 5.434lbs.We can also find the expected weight for a person of 68in height.
Where is this in SPSS, and what is this going to look like elsewhere? 1 From this data file
Where is this in SPSS, and what is this going to look like elsewhere? Choose this analysis 1
Where is this in SPSS, and what is this going to look like elsewhere? 1 Specify dependent and independent variables
INTERCEPT SLOPE Where is this in SPSS, and what is this going to look like elsewhere? SPSS output: 1
And how about Excel? • Excel’s regression function can be accessed via the wizard, but it still needs some extra knowledge to get it to work, so I’m just going to show you the muggle (non-wizard) way 1
And how about Excel? 1. Select a 2 (columns) by 5 (rows) array 1
Excel… 1 2. Use the “linest” (linear estimate) function 3. The first array is the dependent variable 5. After 2 commas, “true” means you want all the stats 4. The second array is the independent variable
Excel… 1 6. Hit [CTRL_SHIFT_ENTER] at end of function – NOT enter… …and here’s all the stuff slope intercept R2 F
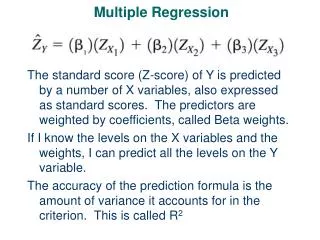
SLOPE INTERCEPT Weight’ = -234 + 5.434 (Height) The regression equation 4 values of the i.v. (predictor) 1 General form of equation: Predicted values of the d.v. Y’ = a + bX 2 3
A note on the equation and error • Here is another general form of the equation from a text book: 1 For an actual value y… Don’t be confused by this…it’s obvious really. It’s the error term. Note “actual” y, rather than predicted y, is on the left
A note on the equation and error 2 1 The least squares method used in regression just minimizes the sum of these squared vertical distances e7 4 e5 e6 e4 e2 e3 e1 3
How good, generally, is the fit? 1 • R2 • Coefficient of determination • Standard error of the estimate • The average size of the error in predicting any value of Y • The standard deviation of actual Y’s about predicted Y’s • Or, the SD of the “e’s” (residuals) • Critically related to R2 2 3 4 5 6
r = .81 More on the SE of estimate 1 • At any point of X, the various Y’s are expected to be normally distributed about the regression line 3 Height = 63” 2
More on the SE of estimate • That means that you can set up expected margins of error of Y about Y’ • E.G. What proportion of Y’ would fit within 2 standard errors of the estimate? • ?? • All depends upon key assumptions… • Homoscedasticity • Linear relationship between X and Y • Y normally distributed about Y’ 1 2 3