Download
1 / 11
120 likes | 312 Views
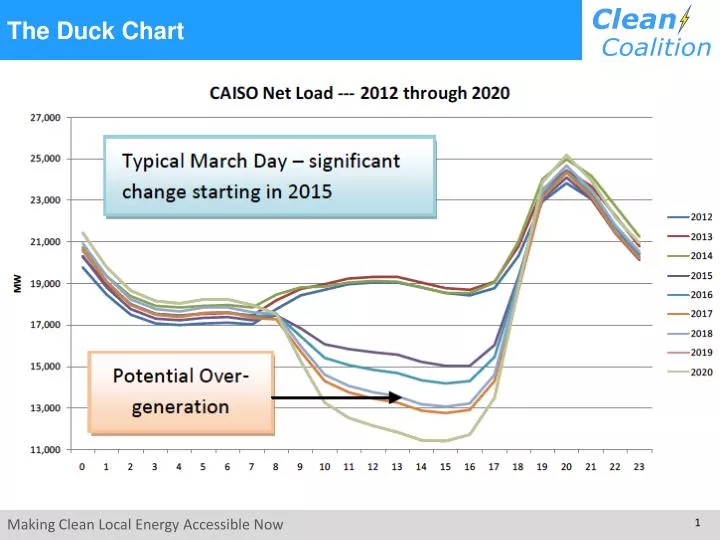
The Duck Chart. Potential 2020 Ramping Issues. Projected 2020 Ramp Rates. 13,500 MW in 2 hours. 6,300 MW in 2 hours. 8,000 MW in 2 hours. Addressing the Duck Chart. Addressing the Duck Chart. Highest net load: 33,400 MW at 7pm. Lowest net load: 19,600 MW at 4pm.

E N D
Projected 2020 Ramp Rates 13,500 MW in 2 hours 6,300 MW in 2 hours 8,000 MW in 2 hours
Addressing the Duck Chart Highest net load: 33,400 MW at 7pm Lowest net load: 19,600 MW at 4pm
Addressing the Duck Chart with Import/Export Import/Export
Addressing the Duck Chart with Demand Response Demand Response
Addressing the Duck Chart with Energy Storage Energy Storage
Addressing the Duck Chart with Curtailment Curtailment