Download

1 / 16
180 likes | 345 Views
The Coordinate Plane. Target: Locate and graph ordered pairs on a coordinate plane. In a bag full of marbles, there were 6 green, 2 red and 4 blue marbles. If a marble is chosen from the bag and then returned, find P(green) P(red) P(blue) P(not blue)

E N D
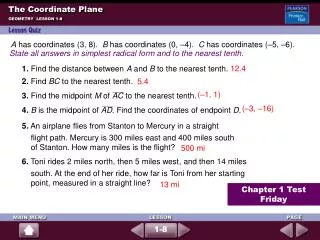
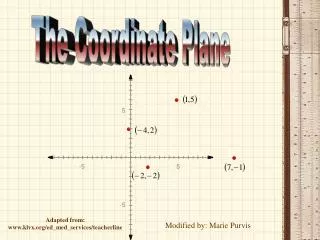
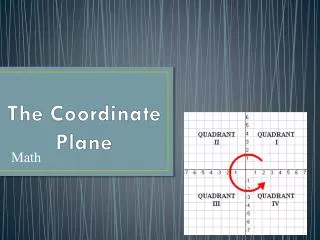
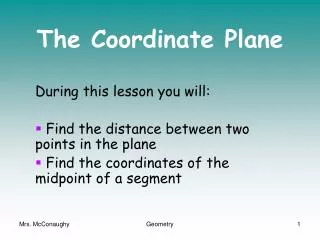
The Coordinate Plane Target: Locate and graph ordered pairs on a coordinate plane
In a bag full of marbles, there were 6 green, 2 red and 4 blue marbles. If a marble is chosen from the bag and then returned, find • P(green) • P(red) • P(blue) • P(not blue) • The ratio of girls to boys in Mr. D’s class is 12 : 13. What is the ratio of girls to all students in Mr. D’s class? • Solve for y in the similar figures.
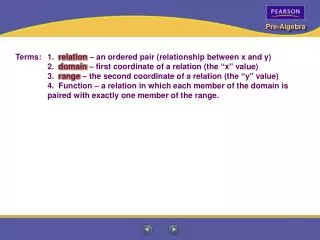
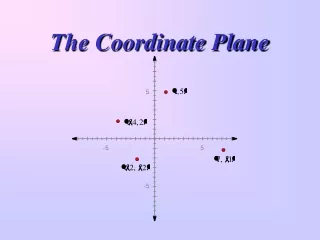
x-axis: • The horizontal # line • y-axis: • The vertical # line • Origin: • where the two # lines cross each other • Quadrants: • The 4 quarters: • I, II, III, & IV • Ordered Pair: • Pair = 2 • Order is x 1st then y … (x,y)
y - axis 3 x - axis 2 1 – 1 – 2 – 3
Quadrants Coordinate Plane y - axis II I Origin x - axis III IV
Example 1 Graph each point and name the quadrant where it is located. a. A(4, 6) • Quadrant I b. B(3, -2) • Quadrant IV c. C(0, -8) • None, y-axis d. D(-5, 7) • Quadrant II D A 6 B 4 C
Example 2abc Chose the letter with the given ordered pair. a. (5, 0) • U b. (-4, 6) • V c. (-5, -2) • R
Example 2def Chose the letter with the given ordered pair. d. (8, -7) • T e. (0, 3) • S f. (0, 0) • P
Example 3ab Use the table of values listed to the right a. Write the ordered pairs from the table using parentheses. • (-3, -6), (-2, -4), (-1, -2), (0, 0), (1, 2), (2, 4), (3, 6) b. Graph the ordered pairs on a coordinate plane.
Example 3c Based on your graph, if the x-coordinate is 6, what would the y-coordinate be? • (6, 12)
B C • Write the ordered pair for each point on the graph at right. a) A b) B c) C • Write the ordered pairs for each point in the table.Graph the points. A
Communication Prompt What are the similarities and differences between graphing the point (3, 7) and the point (-3, -7)?
Lesson 20 Proportionality The Coordinate Plane
Example 4 a. Make a scatter plot of the data. Label the x-axis “age” and the y-axis “height.” b. Is there are relationship between the age of a person and the person’s height? • Yes, as the age increases so does the height. c. Do you think this relationship will continue until someone is 70 years old? Explain. • No. People stop growing.