Download
1 / 22
240 likes | 390 Views
Surface Wave Propagation through the Bohemian Massif Preliminary Results from the PASSEQ Experiment. Jiri Malek Petr Kolinsky Oldrich Novotny Renata Gazdova and PASSEQ working group Institute of Rock Structure and Mechanics Academy of Sciences of the Czech Republic. ESC 200 8

E N D
Surface Wave Propagation through the Bohemian Massif Preliminary Results from the PASSEQ Experiment Jiri Malek Petr Kolinsky Oldrich Novotny Renata Gazdova and PASSEQ working group Institute of Rock Structure and Mechanics Academy of Sciences of the Czech Republic ESC 2008 September 2008 Hersonissos, Crete, Greece
Contents PASSEQ experiment Surface wave analysis Mean S-wave model of the Bohemian Massif Conclusions Malek, Kolinsky, Novotny and Gazdova: Surface waves
PASSEQ - Passive Seismic Experiment in the Trans-European Suture Zone Experimental part: May 2006 - June 2008 147 SP and 49 BB stations in Poland Germany Czech Republic and Lithuania Surface wave analysis Preliminary resultsfrom the Bohemian Massif Data from PASSEQ and from the Czech Regional Seismic network Contents PASSEQ experiment Surface wave analysis Mean S-wave model of Bohemian Massif Conclusions Malek, Kolinsky, Novotny and Gazdova: Surface waves
Selected earthquakes for surface wave studies Contents PASSEQ experiment Surface wave analysis Mean S-wave model of Bohemian Massif Conclusions 56 earthquakes MS>5.5 with a good azimuthal coverage Malek, Kolinsky, Novotny and Gazdova: Surface waves
Azimuthal coverage at station Pruhonice (PRU) Contents PASSEQ experiment Surface wave analysis Mean S-wave model of Bohemian Massif Conclusions Malek, Kolinsky, Novotny and Gazdova: Surface waves
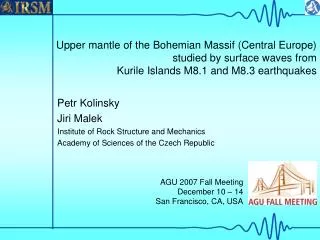
Different group velocity dispersion (source - station) Contents PASSEQ experiment Surface wave analysis Mean S-wave model of Bohemian Massif Conclusions Continental path Kurile Islands M 8.1 and M 8.3 8.600 km Mainly oceanic path Scotia Sea M 7.0 13.000 km Malek, Kolinsky, Novotny and Gazdova: Surface waves
Different group velocity dispersions (source - station) Continental path Kurile Islands M 8.1 and M 8.3 8.600 km Contents PASSEQ experiment Surface wave analysis Mean S-wave model of Bohemian Massif Conclusions Mainly oceanic path Scotia Sea M 7.0 13.000 km Malek, Kolinsky, Novotny and Gazdova: Surface waves
Same phase velocity dispersions (station - station) Contents PASSEQ experiment Surface wave analysis Mean S-wave model of Bohemian Massif Conclusions Kurile Islands M 8.1 and M 8.3 Scotia Sea M 7.0 Malek, Kolinsky, Novotny and Gazdova: Surface waves
Surface wave analysis – SVAL program Kolinsky (2005) Contents PASSEQ experiment Surface wave analysis Mean S-wave model of Bohemian Massif Conclusions • Time-frequency transformation • multiple filtering with Gaussian filters • constant relative resolutionfiltering • instantaneous period estimation Malek, Kolinsky, Novotny and Gazdova: Surface waves
Contents PASSEQ experiment Surface wave analysis Mean S-wave model of Bohemian Massif Conclusions • Selection of fundamental mode Frequency-time spectrogram Truncated fundamental mode velocity (km/s) velocity (km/s) period (s) period (s) Malek, Kolinsky, Novotny and Gazdova: Surface waves
Contents PASSEQ experiment Surface wave analysis Mean S-wave model of Bohemian Massif Conclusions Set of quasi-harmonic signals Kurile Island M=8.3 Malek, Kolinsky, Novotny and Gazdova: Surface waves
Contents PASSEQ experiment Surface wave analysis Mean S-wave model of Bohemian Massif Conclusions Set of coherent signals at two stations (time shift = 41 s) Malek, Kolinsky, Novotny and Gazdova: Surface waves
Particle motion in horizontal plane Contents PASSEQ experiment Surface wave analysis Mean S-wave model of Bohemian Massif Conclusions Kuril Islands 8700 km Scotia Sea 13000 km Malek, Kolinsky, Novotny and Gazdova: Surface waves
Structure Contents PASSEQ experiment Surface wave analysis Mean S-wave model of Bohemian Massif Conclusions • Forward modeling • - Dispersion curves are computed by a matrix method • Modified Thomson – Haskell matrices • Proskuryakova et al. (1981) • Inversion • Isometric Method (IM) • Non-linear inverse problems with many parameters • Malek et al. (2005 and 2007) Malek, Kolinsky, Novotny and Gazdova: Surface waves
Contents PASSEQ experiment Surface wave analysis Mean S-wave model of Bohemian Massif Conclusions Parameters - Love wave phase velocity inversion: vS model - Rayleigh wave phase velocity inversion: vS and vP/vS ratio - depths of interfaces are fixed during the inversion Malek, Kolinsky, Novotny and Gazdova: Surface waves
S-wave velocity model of the Bohemian Massif Contents PASSEQ experiment Surface wave analysis Mean S-wave model of the Bohemian Massif Conclusions Germany Poland Czech Republic Austria Slovakia Malek, Kolinsky, Novotny and Gazdova: Surface waves
SOUTHERN GREECEMS = 6.3 D = 1393 km from KHU Contents PASSEQ experiment Surface wave analysis Mean S-wave model of Bohemian Massif Conclusions Malek, Kolinsky, Novotny and Gazdova: Surface waves
ICELANDMS = 6.3 D = 2640 km from HAJ Contents PASSEQ experiment Surface wave analysis Mean S-wave model of Bohemian Massif Conclusions Malek, Kolinsky, Novotny and Gazdova: Surface waves
EASTERN SICHUAN, CHINAMS = 7.9 D = 7452 km from JAC Contents PASSEQ experiment Surface wave analysis Mean S-wave model of Bohemian Massif Conclusions Malek, Kolinsky, Novotny and Gazdova: Surface waves
Mean dispersion curve Contents PASSEQ experiment Surface wave analysis Mean S-wave model of Bohemian Massif Conclusions Malek, Kolinsky, Novotny and Gazdova: Surface waves
Contents PASSEQ experiment Surface wave analysis Mean S-wave model of Bohemian Massif Conclusions red line - present study, violet line - vSV (model STW105) Kustowski B., Ekström G., and A. M. Dziewoński (2008), Anisotropic shear-wave velocity structure of the Earth's mantle: A global model , J. Geophys. Res., 113. Malek, Kolinsky, Novotny and Gazdova: Surface waves
Conclusions Contents PASSEQ experiment Surface wave analysis Mean S-wave model of Bohemian Massif Conclusions • PASSEQ data were used for determination of an S-wave velocity • model of the Bohemian Massif down to 200 km • from surface waves dispersion. • Rayleigh wave phase velocity dispersion curves • between couples of stations were studied. • Low velocity channel (astenosphere) was found • in the depths of 50 – 145 km. • Astenosphere is more pronounced than in the average • world model STW 105. Many thanks to Jan Zednik for data from the Czech Regional Seismic Network Malek, Kolinsky, Novotny and Gazdova: Surface waves