Download
1 / 21
230 likes | 476 Views
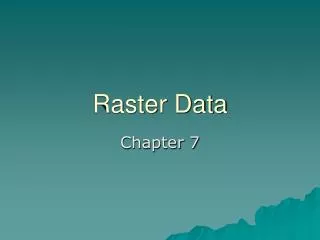
Raster Database. Group 3 Akash Agrawal and Atanu Roy. Chapter Organization. 1.1 Raster Data 1.2 Raster Data in GIS 1.2.1 Spatio-Temporal Data 1.2.2 Field Operations 1.2.3 Storage 1.2.4 Retrieval Techniques 1.3 Concluding Remarks. Learning Objectives. Learning Objectives (LO)

E N D
Raster Database Group 3 Akash Agrawal and Atanu Roy
Chapter Organization • 1.1 Raster Data • 1.2 Raster Data in GIS • 1.2.1 Spatio-Temporal Data • 1.2.2 Field Operations • 1.2.3 Storage • 1.2.4 Retrieval Techniques • 1.3 Concluding Remarks
Learning Objectives • Learning Objectives (LO) • LO1 : Learn about Raster Data • LO2 : Learn about GIS Raster Database • Why use Raster data in GIS? • How Spatio-temporal data is represented? • What are different Field operations? • What are different Storage techniques? • What are different Retrieval Techniques? • Mapping Sections to learning objectives • LO1 - 1.1 • LO2 - 1.2
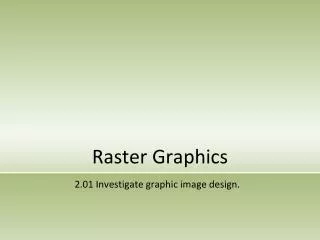
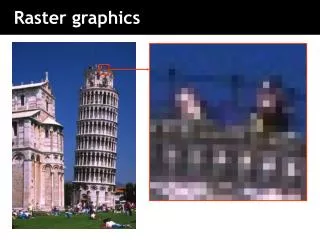
Raster Data • A raster image is rows and columns of cells organized in a rectangular grid. • Each cell is called a Pixel. • Each pixel stores a singular color/attribute value. • Resolution of rater image is denoted by #pixels in row X #column of the grid. • 800X600 resolution denotes that the raster image contains 600 rows of 800 pixel each.
Learning Objectives • Learning Objectives (LO) • LO1 : Learn about Raster Data • LO2 : Learn about GIS Raster Database • Why use Raster data in GIS? • How Spatio-temporal data is represented? • What are different Field operations? • What are different Storage techniques? • What are different Retrieval Techniques? • Mapping Sections to learning objectives • LO1 - 1.1 • LO2 - 1.2
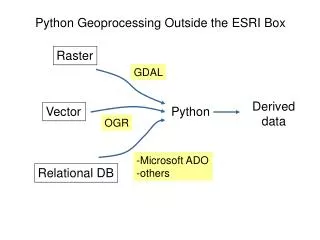
Raster Data in GIS • The primary purpose is to display the detailed image on a map area or render its identifiable objects by digitization. • Raster maps are ideally suited for mathematical modeling and quantitative analysis. • Data storage techniques data are easy to program and gives good performance for data retrieval. • Commonly used form of raster data in the field of GIS • aerial photographs of some area. • Other raster datasets used in GIS • a digital elevation model • Map of reflectance of a particular wavelength of light. • Landsat • Electromagnetic spectrum indicators
Learning Objectives • Learning Objectives (LO) • LO1 : Learn about Raster Data • LO2 : Learn about GIS Raster Database • Why use Raster data in GIS? • How Spatio-temporal data is represented? • What are different Field operations? • What are different Storage techniques? • What are different Retrieval Techniques? • Mapping Sections to learning objectives • LO1 - 1.1 • LO2 - 1.2
How Spatio-Temporal data is represented? • The ST data has become crucial • to understand cause and effect scenarios • development of dynamic models for the analysis of it. • The Snapshot Model • Every layer in the snapshot model shows the state of geographic distribution at one time stamp. • Time intervals between any two layers may vary • There is no explicit implication for changes within the time lag of any two layers.
Learning Objectives • Learning Objectives (LO) • LO1 : Learn about Raster Data • LO2 : Learn about GIS Raster Database • Why use Raster data in GIS? • How Spatio-temporal data is represented? • What are different Field operations? • What are different Storage techniques? • What are different Retrieval Techniques? • Mapping Sections to learning objectives • LO1 - 1.1 • LO2 - 1.2
Field data • Field data are an essential part of GIS systems. • give most up-to-date information about current events • Needed for creating/updating digital maps • Help in validating the available data sets. • Field data source • Satellites • Geo-registered sensor networks etc. • Field data set example • Satellite images, aerial photographs • Digitized paper maps • Earth Science data-sets, e.g. rainfall, temperature maps
Field operations • Field data can be manipulated using • Map algebra • Image algebra • Map algebra vs. Image algebra • Similarity: • Operand: raster data • Difference: • Image algebra deals with image properties such as color information, number of pixel, pixel size etc. Example trim/crop, zoom in/out etc. • Map algebra deals with attribute maps such as temperature map, vegetation map etc. Example thresholding, gradient etc.
Map Algebra • Map algebra • Operand: raster data • Operation: classified in four groups • Local, focal, global and zonal • Local operation: • The value of a cell in the new raster is computed only using the value of that cell in the original raster. • Example thresholding, point wise addition etc. Figure: An example thresholding with threshold value of 4
Map Algebra (Cont…) • Focal operation: • The value of a cell in the new raster is computed using the value of that cell and its neighboring cells in the original raster. • Example focal sum, gradient etc. Figure: An example of focal operation. (a) Rook neighborehood. (b) Bishop neighborehood. (c) Queen neighborehood. (d) Focal sum using queen neighborehood.
Map Algebra (Cont…) • Global operation: • The value of a cell in the new raster is computed using the location or values of all cells in the original raster data. • Example: global sum, global average etc. • Zonal operation • the value of a cell in the new raster is a function of the value of that cell in the original raster and the values of other cells which appear in the same zone specified in another raster. • Example distance from nearest facility.
Image Algebra • Map algebra • Operand: raster data/ Image • Operation: • ignores the absolute location of pixels. • come from image processing literature. • used for display or rendering the image for manual analysis of demonstration purpose. • Example: trim/crop, zoom in/out, rotate etc. Figure: An example trim operation.
Learning Objectives • Learning Objectives (LO) • LO1 : Learn about Raster Data • LO2 : Learn about GIS Raster Database • Why use Raster data in GIS? • How Spatio-temporal data is represented? • What are different Field operations? • What are different Storage techniques? • What are different Retrieval Techniques? • Mapping Sections to learning objectives • LO1 - 1.1 • LO2 - 1.2
Storage Techniques • Traditional Approach • standard file-based structure of TIF, JPEG, etc. • use custom software to retrieve data-items of interest • Pros: provide good compression and require less storage space. • Cons: difficult to index the data and hence has slower retrieval operation. • Database Approach • stores the raster data items attributes such as geo-location, time-stamp, various properties etc. in database tables. • Use database query language such as SQL to retrieve data-item of interest. • Pros: • allows quicker retrieval of the raster data. • allows user defined attributes and support for ad-hoc queries. • Cons: require storage of millions of significantly sized records.
Learning Objectives • Learning Objectives (LO) • LO1 : Learn about Raster Data • LO2 : Learn about GIS Raster Database • Why use Raster data in GIS? • How Spatio-temporal data is represented? • What are different Field operations? • What are different Storage techniques? • What are different Retrieval Techniques? • Mapping Sections to learning objectives • LO1 - 1.1 • LO2 - 1.2
Retrieval Techniques • Raster data sets are very rich in content • Retrieval approaches • Meta-data approach (database approach) • Content based retrieval (image processing technique) • Meta-data approach • stores values of descriptive attributes for each raster data item. • uses simpler SQL data types such as numeric, string, date etc. • queries to select a set of descriptive attributes such as location, time-stamp, subject etc. • Pros: • Simpler to implement • gives accurate answers for queries to select a set of descriptive attributes. • Cons: • Queries are limited to descriptive attributes. • does not support “similarity” based queries
Retrieval Techniques (Cont…) • Content based retrieval or content based image retrieval (CBIR) • content of an image is represented by extracted primitive visual features such as representing color, shape and texture. • Similar image queries are answered based on some combination of these primitive features. • CBIR is a two step approach • Step 1: compute a feature vector or attribute relation graph (ARG) for each image in the database. • Step 2: given a query image, compute its ARG and compare to the ARGs in the database for the image most similar to the query image. • The success of this approach depends on efficiency of feature and similarity measure, used to compare two ARGs.