Download
1 / 20
200 likes | 208 Views
This presentation discusses decision table classifiers as a simplified and visual way for business users to analyze their data. Topics covered include the goals of decision table classifiers, evaluation of current classifiers, empirical evaluation, and the visualization of decision tables. The conclusion highlights the advantages of decision table classifiers for business users.

E N D
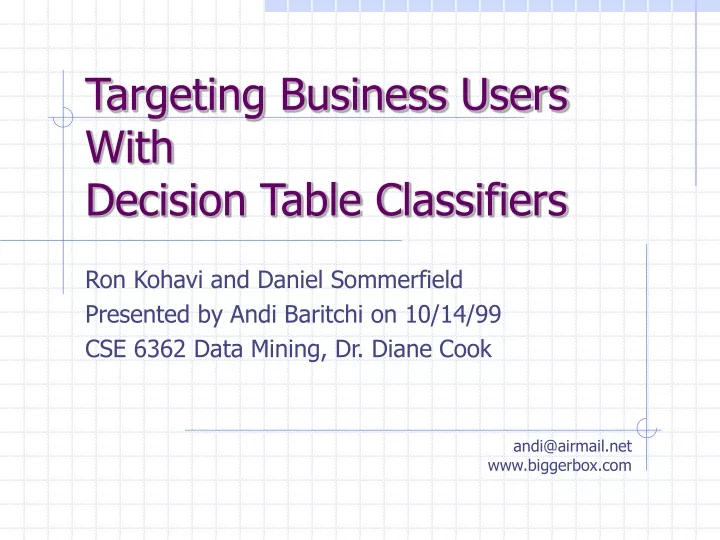
Targeting Business UsersWithDecision Table Classifiers Ron Kohavi and Daniel Sommerfield Presented by Andi Baritchi on 10/14/99 CSE 6362 Data Mining, Dr. Diane Cook andi@airmail.net www.biggerbox.com
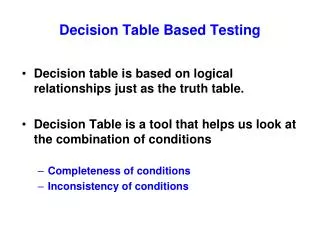
Classifiers for Business • Business users commonly use spreadsheets & 2D plots to analyze their data. • Most machine learning research has been focused on models too complicated for business users.
Presentation Flow • Goals of decision table classifiers • Evaluation of current classifiers • Decision tables • Decision table classifiers • Empirical evaluation • Visualizing decision tables • Conclusions
Goals of Decision Table Classifiers • To classify data quickly with low error rates • To use a low number of attributes and produce small, easily understandable classifiers • (Opt) Visualizer: to graphically represent the classifier in an easy to read format
Naïve Bayes and Decision Trees (Business Evaluation) • Business clients found naïve Bayes much more interesting than decision trees • Decision trees also found interesting patterns but the clients were uncomfortable with the decision tree structure
Need for a Better Model • Naïve Bayes & decision trees are too complex for business users to understand. • Business users need something that produces small, easy to understand classifiers. A spreadsheet-like classifier model that can be represented visually with good clarity.
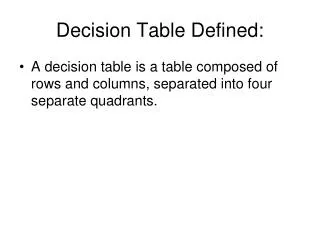
Decision Table • Flat training set data with most attributes stripped off • Only “important” attributes remain. (Choosing attributes is explained later.)
Decision Table Classifiers • (1) try to match test data with instances in decision table. Return majority class in match set. • (2) if no exact match, two options: • Return majority class of training data (“DTMaj”). • Remove attributes from end of decision table until a match is found. Then return majority class in match set (“DTLoc”).
DTMaj Vs. DTLoc • Both methods behave identically for exact matches.. But results vary considerably when there is no match. • DTLoc should have more accurate results than DTMaj because of “neighborhood” matches..
Inducing Decision Tables • Rather than using wrapper-based approach like previous DT work, this research used an entropy-based attribute selection approach. • For more information, see (Kohavi & Li 1995).
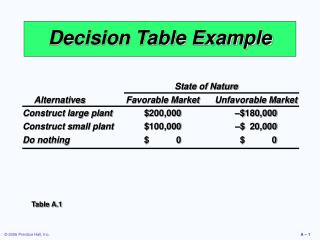
Empirical Evaluation • Tested C4.5, DTMaj, and DTLoc on several large datasets from UCI repository. • Results on next slide.
Empirical Evaluation Analysis • Decision tables will generally be inferior for multiple-class problems. • However, decision tables will generally be superior in noisy domains. • Decision tables use significantly less attributes than decision trees, for smaller and easier to understand classifiers.
Visualizing Decision Tables • Authors created a visualization tool for business users. Users can specify number of attributes and coarseness. • Visualization shows matrix of cakes at intersecting attribute values. Cakes have slices (representing labels) and height (number of records for the intersection).
Conclusions • Decision table classifiers are easier for business users to understand than naïve Bayes or decision trees. • DTs use less attributes, allowing business users to better pinpoint attributes in need of attention.
Conclusions • For large datasets tested, DTCs with a very small number of attributes can generally match C4.5’s accuracy. • Decision table classifiers, with a good visualizer, make it easy for business users to classify records.
References • (Kohavi & Sommerfield 1998) Targeting Business Users with Decision Table Classifiers • (Kohavi 1995) The Power of Decision Tables • (Kohavi & Li 1995)Oblivious Trees, Graphs, and Top-down Pruning