Download
1 / 14
140 likes | 161 Views
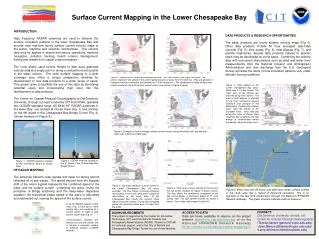
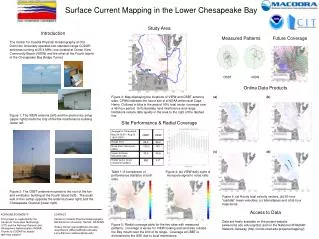
This study focuses on surface current mapping in the Lower Chesapeake Bay region, utilizing 25.4 MHz CODAR antennas at field sites such as Chesapeake Bay Bridge Tunnel (CBBT) and Ocean View Community Beach. Data products are updated hourly and cover radial coverage antenna patterns, total current vectors, sub-tidal flow trajectories, and data validation processes. The study also includes comparisons between ideal and measured antenna patterns, tidal analysis, and comparisons with NOAA ADCP data. Future plans involve GIS incorporation, model comparisons, and web page development for data accessibility.

E N D
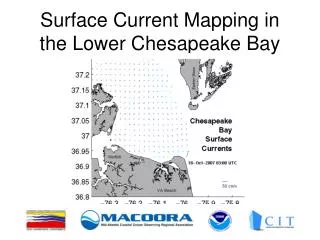
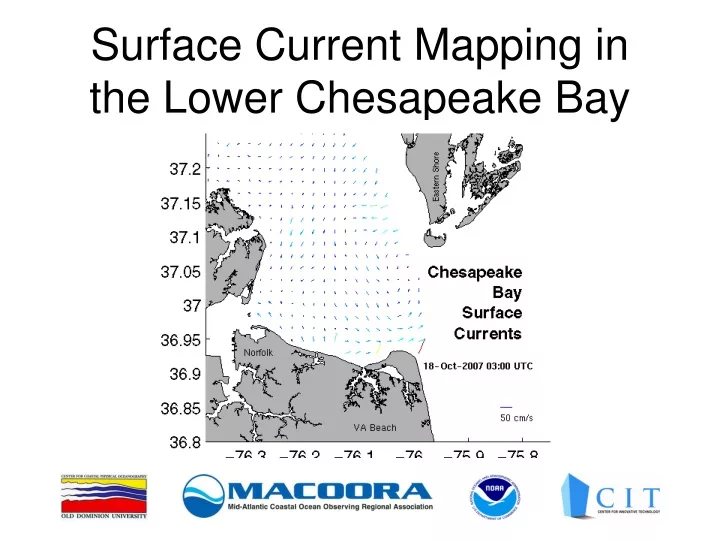
Surface Current Mapping in the Lower Chesapeake Bay <insert movie>
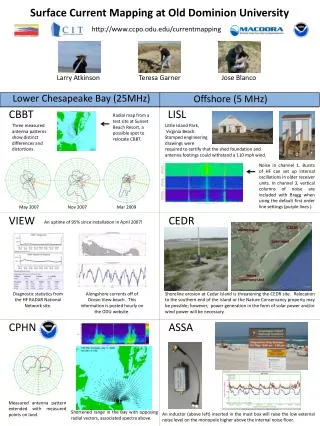
Chesapeake Bay Bridge Tunnel (CBBT) AT OUR FIELD SITES 25.4 MHz CODAR Standard Range Antennas with co-located Tx/Rx MiniMac Field Computers Cell phone/Cable modem connections Ocean View Community Beach (VIEW)
Radial Coverage Antenna Patterns CBBT VIEW
Grid for Total Current Vectors 2 km Grid courtesy of CORDC National Network Preserves orthogonality Red points fail stability angle requirements Baseline
Data Products Updated Hourly (http://www.lions.odu.edu/org/cbc) Time Series Sub-tidal Flow Trajectories
Some Q/C Considerations • Totals • GDOP/HFR-Progs Matlab toolbox error estimates • Radials • Codar spatial and temporal variability statistics within the radial file • Both • Visual outliers (check neighboring vectors / apply filter)
Data Validation by Comparison • Baseline (consistency check) • Tide • Moored ADCP • Towed ADCP
Baseline Comparisons Ideal antenna patterns Measured antenna patterns
Moored ADCP Comparison Difference Statistics Red line = CODAR Blue line = NOAA ADCP Black = |NOAA-CODAR| SiteMeanS.Dev Cape Henry 16.2 14.0 Thimble Shoals 13.2 11.2 York Spit 13.9 10.0 (CH) (TS) (YS)
Towed ADCP Comparisons Intensive study at the baseline & comparison with monthly Bay Mouth cruises
Future Plans • Incorporate data into GIS; map with other regional spatial data • Normal Mode Analysis • Continue to work with trajectories/ plume tracking • Model comparisons • Web page development where totals and time series are freely available for download • Shipping channels • Ocean View beaches AVHRR SST Daily Composite, September 24, 2007 from NOAA Coastwatch ChesROMS model output
Acknowledgements • Larry Atkinson and Jose Blanco • CIT, MACOORA, NOAA • CODAR support • Advice and assistance from numerous other HF RADAR operators