Download
1 / 41
410 likes | 434 Views
Learn about the challenges of higher dimensions in nearest neighbor search and construction of kNN graphs. Explore methods like kd-trees and efficient algorithms for high-dimensional data.

E N D
Fast nearest neighbor searches in high dimensionsSami Sieranoja
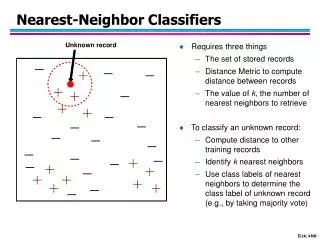
Nearest neighbor problems Notation: k = number of neighbors, not clusters (k-means).
Contents • (exact) Nearest neighbor search in low dimensions • What makes higher dimensions (D>20) difficult • (approximate) High dimensional k nearest neighbor graph construction
Introduction In clustering, KNN graph: • Has been used in agglomerative clustering[1]. • Has potential to speed up k-means (open question). [1] P. Fränti, O. Virmajoki and V. Hautamäki, "Fast agglomerative clustering using a k-nearest neighbor graph", IEEE Trans. on Pattern Analysis and Machine Intelligence, 28 (11), 1875-1881, November 2006.
Brute force search • K Nearest neighbor search: • Brute force O(N) method calculates distances from query point q to all points. • Faster (exact) log(N) methods exist, but only for low dimensional data kNN graph construction: • Brute force O(N2) method calculates between all pairs of points. • Faster (exact) N*log(N) methods exist, but only for low dimensional data
Nearest neighbor search in low dimensions: kd-tree D=2 dimensional dataset with N=14 points (black circles) • Take first dimension • Divide points into two halves according to median • Continue step 2 recursively for next dimension Number of recursions: log(N) log(N=14) = 3.8 Tree contruction: O(N*log(N)) K-nearest neighbor search using tree: O(log(N)) K-nn graph: O(N*log(N))
Nearest neighbor search using kd-tree If nearest neighbor ball is within bounding rectangle AND Have checked all points within that rectangle => Results are exact R
What makes higher dimensions difficult? (Why kd-trees fail)
Recursive subdivision in high dimensions • For large D, leaf nodes are reached before handling all dimensions. • Number of recursions to construct tree: log(N) • What if D > log(N) ? → • Only a log(N)/D portion of data is used to construct the tree. • D=1000, N=1,000,000. log(N) = 20 • log(N)/D = 2%. 4 steps to construct:
Recursive subdivision in high dimensions • Fast methods are possible for large enough data sets • For log(N)/D >= 1, data set size of N=2D needed. • D=20 ⇒ N=1,048,576 • D=1000 ⇒ N = 21000 = 10301 4 steps to construct:
Searching the bounding rectangle • Works because rectangle is usually not much larger than the circle • Best case: square with side length 2R • 2D: If 10 points inside circle, how many expected to be inside rectangle? • 3D? K=9 nearest neighbor sphere/cube: 2R R
Estimating number of expected points using volume K=9 nearest neighbor sphere/cube: Assume R=0.5. Size of rectangle: V=(2R)2=1 Size of cube: V=(2R)3=1 Size of D-dimensional hypercube: V=(2R)D=1 Volume of 2D rectangle: V=πR2 Volume of 3D sphere: Volume of D-dimensional Hypersphere: Volumes of the sphere and cube correspond to the number of expected points in that area, assuming points are uniformly distributed. 2R R
Volume of unit diameter hypersphere vs. hypercube For D=2, if ten points within sphere, 10/0.79 = 13 points expected to be within rectangle K=9 nearest neighbor sphere/cube: 2R R D→inf ⇒ Volume(Hypersphere)/Volume(Hypercube) → 0
KNN graph for high dimensional data • For high dimensional data (D>20, Euclidean space), no known exact method exists, faster than brute force O(N2). • Approximate methods exist that produce > 90% accurate graph in just 1% time of the brute force method.
Existing methods • Existing methods: KGRAPH[1], NNDES[2], Lanczos[3], LSH[4], LargeViz[5] • [2] Wei Dong. KGraph[software]. Available from http://www.kgraph.org/. 2014. • [3] W. Dong, C. Moses, and K. Li, “Efficient k-nearest neighbor graph construction for generic similarity measures,” in Proceedings of the 20th international conference on World wide web, p. 577–586, ACM, 2011. • [4] J. Chen, H.-r. Fang, and Y. Saad, “Fast approximate k NN graph construction for high dimensional data via recursive Lanczos bisection,” The Journal of Machine Learning Research, vol. 10, p. 1989–2012, 2009. • [5] Y.-M. Zhang, K. Huang, G. Geng, and C.-L. Liu, “Fast kNN Graph Construction with Locality Sensitive Hashing,” in Machine Learning and Knowledge Discovery in Databases, p. 660–674, Springer, 2013. • [6] J. Wang, J. Wang, G. Zeng, Z. Tu, R. Gan, and S. Li, “Scalable k-NN graph construction for visual descriptors,” in Computer Vision and Pattern Recognition (CVPR), 2012 IEEE Conference on, p. 1106–1113, IEEE, 2012.
Z-order neighborhood propagation(ZNP) • Two parts: (1) graph initialization (2) graph refinement. • Outline of algorithm: • Construct initial graph using one dimensional ordering called Z-order • Improve graph by using Neighborhood propagation. (paper under review)
Z-values G. M. Morton, A computer oriented geodetic data base and a new technique in file sequencing. International Business Machines Company, 1966.
2D grid ordered by Z-values Point 39 Point 27 Quad tree Point 0
Constructing different Z-orders • Shift whole point set X by adding a random vector v to all points. X' = X+vrand • Rotate point set. • 2D rotation: v'=Rv • D > 3: Random permutation of dimensions (Change the order of dimensions)
Different z-order by (1) random shifting of point set (2) rotation
Different z-order by (1) random shifting of point set (2) rotation
Reduce dimensionality, preserve neighbor connections • For high D, bit interleaving in results in very large integers. Therefore, if D > 32, reduce dimensionality to Dz=32 before z-value calculation. • Divide each vector into subvectors with roughly equal sizes • Map each subvector to one dimension by summing the elements • Sums of subvectors form final vector Example, from D=6 to Dz=3:
Neighborhood propagation • Used to improve graph. Different variants used in many methods[2-6]. Most extensively investigated in [3]. • Pseudocode of algorithm: • Do • For each point x ∈ X: • For each pair (y,z) in neighbors of x: • // (Introduce neighbors:) • Add edge (y,z) to G if it improves the graph • end • End • While G improved • [3] W. Dong, C. Moses, and K. Li, “Efficient k-nearest neighbor graph construction for generic similarity measures,” in Proceedings of the 20th international conference on World wide web, p. 577–586, ACM, 2011.
Benchmarks: kNN graph construction (1/2) Image features D = 128 N = 1,000,000 ZNP: Z-order search ZNP+: Z-order search with neighborhood propagation
Benchmarks: kNN graph construction (2/2) Audio features D = 192 N = 54,387 ZNP: Z-order search ZNP+: Z-order search with neighborhood propagation
KNN graph to speed up k-means • K-means assignment step complexity: O(N*C) • When using kNN graph, complexity of assignment is reduced to O(N*k) • Graph construction with brute force: O(C^2) • Total complexity with kNN graph: O(N*k +C^2) Is O(N*k +C^2) faster than O(N*C)?