Download
1 / 23
250 likes | 330 Views
Duration & Dynamics of Orogenic -Type Gold Deposits. S. Micklethwaite, H. Sheldon. Micklethwaite et al., in press, Geofluids Moir et al., 2013, Tectonophys Micklethwaite et al., 2010, J.Struct.Geol . Micklethwaite, 2010, Great Basin Metallogeny Symposium

E N D
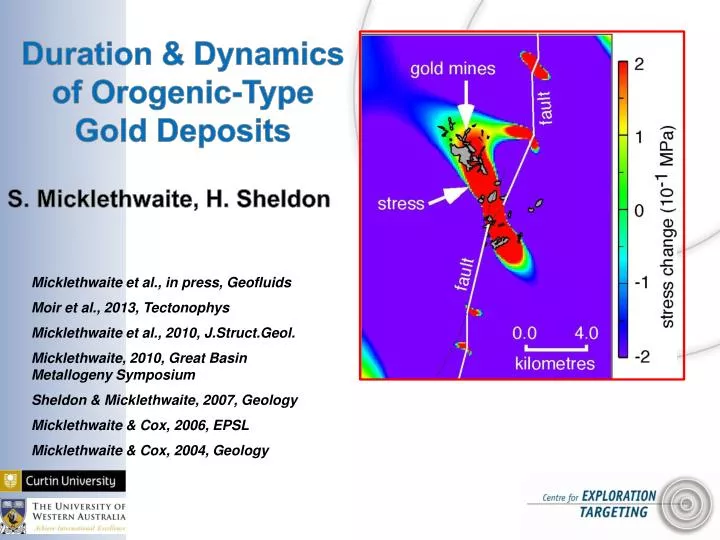
Duration & Dynamics of Orogenic-Type Gold Deposits S. Micklethwaite, H. Sheldon Micklethwaite et al., in press, Geofluids Moir et al., 2013, Tectonophys Micklethwaite et al., 2010, J.Struct.Geol. Micklethwaite, 2010, Great Basin Metallogeny Symposium Sheldon & Micklethwaite, 2007, Geology Micklethwaite & Cox, 2006, EPSL Micklethwaite & Cox, 2004, Geology
Introduction Orogenic ore deposit formation strongly linked to permeability (k) enhancement during earthquake generation processes (mid to shallow crust): Clustered, mineralisation on 2nd – 3rd order structures adjacent to master structures. Multiple overprinting vein and breccia textures. Extension fracture geometries relative to shear zones. FLINCS, immiscible fluids from single low salinity fluid. Implies association with mod long duration self-organising process (seismogenesis), involving fluids Here, explore these dynamics and profound implications for duration of deposit formation • SELF-ORGANISATION • Open systems, • Continuous addition of M or E, • Evolution to critical state, • Transient, pulsed escape events of M or E, • Spontaneous order across range of scales (fractal). • Micklethwaite, Hronsky and others, Ec.Geol.
Argo, St Ives Argo, St Ives Characteristics: Orogenic Deposits Tenthorey et al., 2003, (EPSL) Micklethwaite 2008 (G3) Mutual overprinting relationships. Multiple increments. Transient pulses of overpressured fluid.
Boulder-Lefroy Fault; 5 km buffer Deposit location and endowment; 2T cut-off D = 0.943 R2 = 0.999 MINEDEX Historical and active shafts & pits (oreshoot equivalent) Further evidence for self-organising properties: Clustering (endowment & deposits) with periodic spacing Power-law size frequency distributions in along-strike ore deposit distribution Box number Box dimension (km)
Geometry & Scaling Properties 2l is the overlap/underlap distance 2s is the separation distance Unlike previous step-over scaling studies, l becomes negative when overlapping - Provides a distinction between overlap or underlap
Note: deposit data from orogenic, carlin & porphyry deposits Consistent step-over dimension (~3) for both underlapping & overlapping step-overs. Self-similar to a first-order (self-organisation ?) Overlap dominates global data ~10:1. Just 9% of measured step-overs with an underlap geometry BUT … Underlap dominates mineralised step-overs Geometry & Scaling Properties
What is Stress Transfer Modelling? Calculation of static stress changes (change in Coulomb failure stress) proxy for failure of damage zone faults/fractures Numerical Analysis: Stepovers & Damage Landers sequence (1992-1999), M7.2 Earthquake Proxy for near-field aftershocks (>M5) Aftershock damage triggered >5 km away from master fault Stein 2003, Nature
Result (linear tapered models): Larger surface area of damage associated with underlap configurations.
Fluid Flux & Formation Duration Miller et al. 2002, Nature 1997 Umbria-Marche earthquake sequence analogue. Mainshocks rupture overpressured CO2 reservoir at depth. High pressure fluids escape up main fault and adjacent surfaces, triggering a “wave” of aftershocks with time. k is not static. Background k~10-18m2. Co-seismic values transiently 10-13 to 10-8 m2(Noir et al., 1997; Waldhauser et al., 2012; Miller 2013, Adv.Geophys.)
Fluid Flux & Formation Duration Micucki 1998, Ore Geol. Rev. Simmons & Brown 2007, Geol. Giger et al. 2007, J.Geophys.Res. Micklethwaite et al. 2014, Geofluids
Coseismic permeability enhancement permits very large fluid flux over short time periods. Even with slower healing periods, 90% of flux achieved in <5 years. With coseismic permeability enhancement, 5 Moz deposits can feasibly form in 1-16 earthquake-aftershock sequences (1-26 sequences for supergiant deposits). ~10-8000 yrs given lifespans of stepovers (105 yrs) and fault recurrence intervals 100-500 yrs (~10-13,000 yrs for supergiants) Note: Assumes 100% efficiency in stripping Au from fluid (observed Brown 1986) BUT conservative estimates for [Au], gold camp surface area, permeability enhancement Fluid Flux & Formation Duration
Epithermal Au-Ag 30-110 ka intervals in epithermal vein increments Total vein formation ~260 ka (Hishikari) Sanematsu et al., 2006, Ec.Geol. [Au]TVZ and fluid flux rates imply supergiant deposit in <20 ka to 50 ka. Simmons & Brown, 2007, Geol. Rapid Durations of Other Deposit Types
Rapid Durations of Other Deposit Types Supergiant Carlin Au Apatite fission tracks reset in mineralised sediments but not in granodiorite stock. Implies duration of mineralising fluid flux <15-45 ka Hickey et al., 2014, Ec.Geol.
Conclusions Acknowledgements Hammond-Nisbet Endowment S.F. Cox, R. Doutre Orogenic deposit formation controlled by the dynamics of earthquake behaviour (a self-organising system) Duration of formation, even for supergiants, is feasibly in order of 10-104 yrs due to coseismic permeability enhancement (consistent with recent results from Carlin, epithermal and porphyry systems; Hickey et al., 2014, Ec.Geol.; Simmons & Brown 2007, Geol.; Heinrich 2006, Sci) Question? Short duration elevated [Au]aq nested in fault systems with potentially million year active lifespans
Characteristics: Orogenic Deposits 2nd-3rd order faults/shears around master faults (N.B. polyphase history to master structures) Clustered, and association with underlap geometries
Carbonicor H2O-CO2-NaCl fluid inclusions with diversity of densities and CO2 content Different compositions of inclusions in close proximity (cms) within same vein Scatter in Pf estimates at constant temperature (>100-150 MPa range) Reflect entrapment of immiscible fluids, derived from phase separation of single low salinity fluid Pressure drops from overpressured fluids Parry, 1998, Tectonophys Appendix Sibson et al, 1988, Geology
Extension vein orientations relative to shear-extension veins, shear zones & faults Inferred stress field (1 > 2 > 3) and unusually large fault reactivation angle (~60°+) Elevated fluid pressure (supra-lithostatic; Pf = 3 + T) Extension fracture evolves to shear and seal rupture: Cyclical, linked to earthquake rupturing Parry, 1998, Tectonophys Appendix Sibson et al, 1988, Geology
Aydin & Schultz, 1989, J.Geophys.Res. Active Seismogenic Systems: Existing databases of step-over geometries across multiple scales Appendix Wesnousky, 2008, Bull.Seism.Soc.Am
Appendix Burgmann & Pollard, 1994, J.Struct.Geol. Active System Data: Overlap dominates ~10:1 Consistent with expected fault propagation and interaction from fracture mechanics theory
Manighetti et al., 2001, 2005, J.Geophys.Res Appendix Tapered Slip: Slip distributions on the fault segments Uniform 0.4 m Linear tapered, assymetric due to tip restriction, (mean 0.4 m, max slip 0.73 m at 20-30% fault length)
Result (linear tapered models): Underlap promotes increase in surface area for damage triggering and dynamic permeability enhancement, relative to overlap. Average surface area for transient damage ~10,000,000 m2 (tallies with gold camp dimensions) Appendix
Metamorphic data, geothermal measurements, seismic hypocentre migration, thermal modelling Ingebritsen & Manning, 2010 (Geofluids) Appendix k is not static. Changes with temperature/depth Background k at midcrustal conditions is low (~10-18 m2) Co-seismic values transiently 10-13 to 10-8 m2(Noir et al., 1997; Waldhauser et al., 2012; Miller 2013, Adv.Geophys.)