Download
1 / 29
290 likes | 388 Views
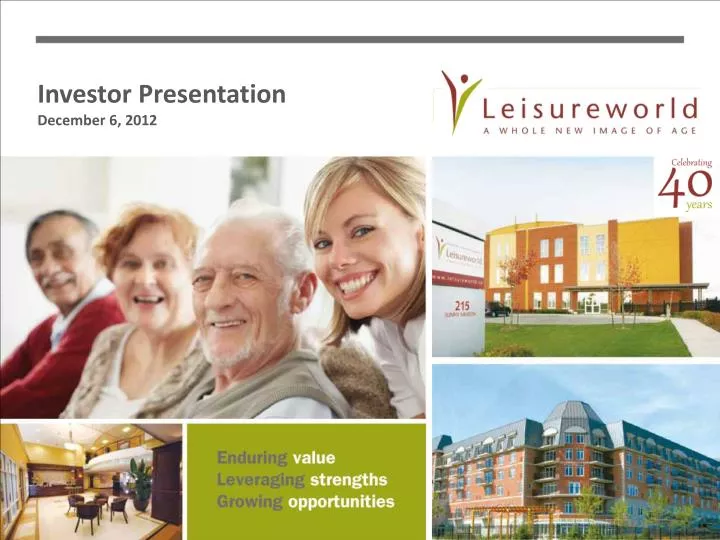
Investor Presentation December 6, 2012. Cautionary Note.

E N D
Cautionary Note Certain information in this presentation and oral answers to questions may contain forward-looking information. Actual results could differ materially from conclusions, forecasts or projections in the forward-looking information, and certain material factors or assumptions were applied in drawing conclusions or making forecasts or projections as reflected in the forward-looking information. Additional information about the material factors and risks that could cause actual results to differ materially from the conclusions, forecasts or projections in the forward-looking information and the material factors or assumptions that were applied in drawing a conclusion or making a forecast or projection as reflected in the forward-looking information are disclosed in disclosure documents filed on SEDAR (www.sedar.com).
Business Overview Canada’s fifth largest operator of seniors housing / ~6,000 employees * Muskoka residence (29 suites) currently being converted to a short stay healthcare and convalescent care facility
Capital Market Profile Analyst Coverage: * Monthly dividend increased to $0.075 per share from $0.0708 per share, effective Dec. 2012
Factors Supporting Growth & Stability Favourable DemographicsCanadians over the age of 75 Source: Statistics Canada
Factors Supporting Growth & Stability Increasing Life Expectancy Source: Statistics Canada; Life expectancy at birth and at age 1, by sex, Canada (1920 – 1922 to 2005 – 2007)
Factors Supporting Growth & Stability Increasing affluence • Relative increases in net worth and household income allow seniors to afford higher quality housing and amenities Changing family dynamics • Dual income families have less time to care for parents • Increasing demand for home healthcare services Provincial governments focused on controlling healthcare costs
Long-Term Care Ontario’s 3rd largest LTC Operator
Ontario Long-Term Care (LTC) Highly Regulated Environment / High Barriers to Entry 77,500 LTC beds Wait List: ~20,000 • Essential service and vital part of community infrastructure • Effectively 100% funded by Ontario government (MOHLTC) • Funding based on need, not economic conditions • Stringent licensing requirements • Additional laws and regulations: public health, safety, privacy
MOHLTC Funding MOHLTC Base Operating Funding Increases Exceed CPI Growth (funding per bed, per day)
MOHLTC Funding Model MOHLTC Funding Envelopes Cost Categories Nursing and Personal Care (NPC) NPC costs Programs and Support Services (PSS) PSS costs Operator Profits Accommodations Raw Food Raw Food Operator Profit Stream MOHLTC Funding Return of Surplus Other Accommodations (OA) Room, Board and Services • Incentive to manage carefully within envelopes • Larger, more professional operators advantaged • Per diem base: $155.19 per day, per bed
MOHLTC Funding Model * Excludes Property Tax Funding at 85% of taxes paid ** A home based on 60% of beds designated private accommodation; new admissions after July 1, 2012 pay higher rate. B and C home amount dependent on number of private and semi-private rooms
LTC Capital Cost Reimbursement *Reflects recent acquisition of Madonna LTC home Construction costs initially borne by LTC home owners • Contracted daily government funding provides substantial offset • Level of reimbursement tied to design and construction standards; not occupancy Construction funding for “New” (Class A) beds • Approximately 54% of Leisureworld portfolio • $10.35 per bed / per day • 15-year term, $96 million support for AFFO* Structural compliance premium; life of license • B beds: $2.50 per day, C beds: $1.00 per day Capital Renewal for B & C homes • Government announcement on complete program revisions expected in 2013 • Recent preferred accommodation increase provides enhanced incentive
Occupancy 100% government funding for occupancy ≥ 97% Government funds at actual plus up to 2% for occupancy between 90% 96% Government funds at actual for occupancy < 90% Preferred accommodation Up to 60% of operator capacity Private: $18.00 per day / $19.75* per day Semi-private: $8.00 per day / 9.00* per day Fees charged directly to residents ~ 22 % of Leisureworld’s LTC NOI Additional LTC Revenue Drivers *Effective July 1, 2012 for new residents
Operating Focus Disciplined Cost Control High Quality Care and Services • Culture of quality: train, benchmark, establish best practices • Continuously monitor care and service delivery • Homes assessed by Accreditation Canada / CARF* Professional On-Site Administration • Administrator on site ensures close oversight, timely response • Support at regional, corporate levels and in other LTC homes Continuous Maintenance & Upgrades • Effective, as >50% of LTC homes built post-1998 (Classified “New”) • Dedicated resource for asset management • Proactive approach • Daily operating expense analysis/control • Centralized purchasing, high volumes for best pricing *Commission on Accreditation of Rehabilitation Facilities
Operating Focus • Maximizing Total & Private LTC Occupancy Rates Private LTC Occupancy Total LTC Occupancy Daily review of occupancy across all LTC homes • LTC average total occupancy: 98.7% (YTD 2012) • Private LTC occupancy: @ maximum allowable level (60% in new homes) Branding and marketing strategies / Survey residents, families and staff
Retirement Expanding our presence across the continuum of seniors living in Canada
Ontario Retirement Residences Kanata • New (2009), five-storey, 148,500 sq. ft. luxury retirement residence • 158 suites, currently in lease-up • Sept. 30, 2012 occupancy: 68.4% • Target net average move-in rate: 2.5 residents per property / month; ~ 90% occupancy by H2 2013 Kingston • New (2009), five-storey, 140,000 sq. ft. luxury retirement residence • 136 suites, currently in lease-up • Sept. 30, 2012 occupancy: 71.3% • Target net average move-in rate: 2.5 residents per property / month; ~ 90% occupancy by H2 2013 Midland Gardens / Muskoka • Midland Gardens: 53 independent living apartments in Scarborough for self-reliant seniors (adjacent to LW’s Scarborough LTC home) • Muskoka retirement residence (29 suites) currently being converted to a short-stay healthcare and convalescent care facility to serve local community
BC Retirement Residences Pacifica – South Surrey • New (2008), two four-storey buildings • 175 suites (130 suites owned by LW); 90 independent / 40 assisted • Sept. 30, 2012 occupancy: 89% Peninsula – South Surrey • New (2006), six-storey building • 127 suites: 92 independent / 35 assisted • Sept. 30, 2012 occupancy: 91% Astoria – Port Coquitlam • New (2010), four-storey building, currently in lease-up • 135 suites: 110 independent / 25 assisted • Sept. 30, 2012 occupancy: 60%
Ontario and BC Portfolios • Five-star accommodations and amenities including: lounges, dining rooms, fireplaces, indoor pools, theatres, exercise facilities, landscaped gardens, chauffeured town cars • Current portfolio occupancy (incl. Midland Gardens) has improved to 74.8% on a consolidated basis, up from 59.5% in Q3 a year ago • New VP for portfolio recently appointed to drive marketing and increase occupancy
Financial Review Revenue Net Operating Income (Years ended Dec. 31; Q1 ended March 31, 2012; Q2 ended June 30, 2012; Q3 ended Sept. 30, 2012) (Years ended Dec. 31; Q1 ended March 31, 2012; Q2 ended June 30, 2012; Q3 ended Sept. 30, 2012) FY2010: LSCLP’s results until March 22, public company results thereafter FY2009: LSCLP’s results
Financial Review Adjusted Funds From Operations (AFFO) Three months ended Sept. 30 Nine months ended Sept. 30
Financial Review Cash distribution & AFFO per share/Payout ratio Cash distributions AFFO *Q2 2010 included a partial dividend payment for March, 2010, as LW completed its IPO and public listing on March 23, 2010
52.1% Debt to Gross Book Value at Sept. 30, 2012¹ $20.1 million in cash & cash equivalents at Sept. 30, 2012 12-month Adjusted EBITDA / Interest Expense²: ~ 2.32 X $10 million undrawn, committed credit facility / $61.5 million revolving credit facility ($35.0 million drawn as at Sept. 30, 2012) Committed to maintaining investment grade rating Ensures sustainable payout ratio of ~ 80% of AFFO Industry-leading credit ratings³ DBRS: A (Stable) S&P: A- (Stable) Financial Review Strong Balance Sheet & Credit Ratings 1 Debt to gross book value ratio is defined as mortgages and other debt payable over total consolidated assets plus the amount of accumulated amortization. 2 Trailing 12 months (DSCR for $310 million bond is 3.05 X) 3 2015 notes
Enduring Value Reliable cash flow for shareholder dividends Stable government funding for LTC operations • LTC operations fully funded by government at ≥97% average annual occupancy • Government funding for LTC: ~ NOI margin 15.3% Occupancy rates • Average total LTC occupancy rate: 98.7% • Private LTC occupancy: 98.2% • Waiting list for LTC in Ontario • Increasing occupancy in non-LTC portfolio Cost controls • Financial discipline supports consistency of NOI
Leveraging Strengths Advantages of scale and sector expertise • Purchasing power • Access to low cost of capital financing • Expertise in real estate management • In-depth knowledge of seniors care • Experience in regulatory issues and government relations • Employee opportunities • Ability to extend client relationships
Growing Opportunities Demand Drivers Market Opportunities • Long-Term Care • Home Care • Retirement Residences • Independent / Assisted Living Residences • Leisureworld Strategic Focus: • To be a leading provider of seniors’ living facilities • and services in Canada • Aging population • Changing family dynamics • Increasing life expectancies • Increasing seniors affluence • Gov’t focus on controlling costs (LTC)