Download
1 / 47
550 likes | 970 Views
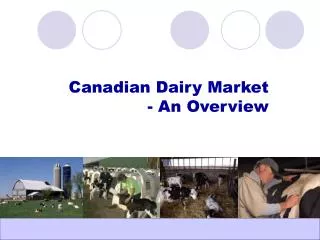
Overview of the Canadian Dairy Industry. Gilles Froment, M.Sc., P.Ag. COO Canadian Dairy Commission, Ottawa February 21, 2014. DM272659. Outline. The Canadian marketing system and its component 3 pillars of supply management Seasonality programs Milk pools

E N D
Overview of theCanadian Dairy Industry Gilles Froment, M.Sc., P.Ag. COO Canadian Dairy Commission, Ottawa February 21, 2014 DM272659
Outline • The Canadian marketing system and its component • 3 pillars of supply management • Seasonality programs • Milk pools • Marketing and innovation initiatives • Current issues
Snapshot of theCanadian Dairy Industry • 12,234 farms producing approximately 8 billion litres of milk (315 million kg BF) • 480 processing plants • Farm receipts: $5.9 billion • Adds a net $10 billion to the GDP* • Processed products sales: $14.7 billion • Supports $15 billion of economic activity* • Sustains more than 215,000 jobs* * Source: EcoRessources
World Cow Milk Production (2012) 6 Source: IDF World Dairy Situation 2013
Further processor Producer Marketing Board (provincial) Retailer Processor Consumer Canada’s Milk Marketing System Regulated market Unregulated market
CMSMC Canadian Milk Supply Management Committee • Permanent body of signatories of the National Milk Marketing Plan - NMMP (voting members) • One vote per province • Dairy Farmers of Canada, Dairy Processors Association of Canada and Consumers’ Association of Canada (non-voting members) • Responsible for policy determination and supervision of the NMMP provisions • Meets 4 times a year • Virtually all decisions require unanimity
The CMSMC directs the implementation of the National Milk Marketing Plan (NMMP)to coordinate actions of provincial marketing boards and governments SK (3) Quebec (4) Non-voting members DFC DPAC P.E.I. (3) CAC CDC chair Ontario (4) N.S. (3) Alberta (3) Newfoundland (3) B.C. (3) N.B. (3) Manitoba (3)
NMMP National Milk Marketing Plan • Federal-provincial agreement • Regulates marketing of industrial milk • Balances supply and demand • Sets out the establishment, distribution and adjustment of industrial milk quota
The Canadian Dairy Commission • Crown corporation created in 1966 • Reports to Parliament through Minister of Agriculture • 3 commissioners, 60 employees • Generally deals with industrial milk • Total budget for 2013-2014: $7.75 million • Funded by government, dairy producers, commercial operations, and the marketplace
Legislated Mandate • Provide efficient producers of milk and cream with the opportunity to obtain a fair return for their labour and investment. • Provide consumers of dairy products with a continuous and adequate supply of dairy products of high quality.
Overview of Key Activities • Chair the CMSMC • Calculate Estimated Requirements (demand) • Recommend Market Sharing Quota • Establish Support Prices • Administer Revenue and Market Sharing Agreements (pools) • Administer Special Milk Class Permit Program • Carry out external audits • Create and administer marketing programs • Remove surplus production • Administer Seasonality Programs
Milk Classes • Industrial (Classes 2-4) • used in the manufacture of butter, cheese, ice cream, yogurt, milk powders • longer shelf life • federal responsibility – interprovincial trade of product • Fluid (Class 1) • used in 1%, 2%, skim milk, etc. and creams • short shelf life • provincial responsibility – historically made and consumed in province of origin
3 Pillars of Supply Management • controlled prices • controlled imports • controlled production
Pillar 1: Controlled Prices • Industrial milk prices • Are determined by provinces based on CDC support prices and vary depending on the end use of the milk • Support prices are the prices at which the CDC buys and sells butter and skim milk powder under its various programs. • Support prices are usually announced in November or December by the CDC to be effective February 1.
Pillar 1: Controlled Prices • Fluid milk prices • are determined by provinces according to a formula • 50% indexed COP • 50% CPI • Valid until February 1, 2016 • Applied once per year (in February)
Milk Prices in last 12 monthsEndingDecember 2013 • Average in-quota revenues : $77.99/hl • Average price for fluid: $94.78/hl • Average price for industrial: $66.63/hl
Pillar 2: Controlled Imports • Most dairy products are protected by Tariff Rate Quota (TRQs). • Above TRQs, dairy products have a tariff of almost 300%.
Pillar 2: Controlled Imports • Examples of TRQ and over-quota tariffs
Pillar 3: Controlled Production • Provincial milk marketing boards allocate production quota to their respective dairy farmers. • This quota combines both fluid milk quota and industrial milk quota. • Fluid milk quota is established by provincial marketing boards and equals demand. • Industrial milk quota is established nationally by the CMSMC and is called Market Sharing Quota (MSQ). • Quota is calculated and expressed in kg of BF.
Establishing MSQ • The CDC calculates the Estimated Canadian Requirements or ECR (demand) on a monthly basis. • ECR = Production + Opening stocks + Imports - Closing stocks - Exports - DIP- Class 4(m) • MSQ is adjusted every two months when ECR increase or decrease.
Evolution of MSQ 1% and 2% milk more popular; lower butter consumption Quota cut of 1976 Low butter stocks
Respecting Production Targets • Provincial production targets: • Upper limit: 0.5% • Lower limit: 1.5% • Provinces are free to have their own policies to adjust their farm quota or not, however, provinces will be penalized if they over or under produce their share of quota. • Over production: no payment for the milk + penalty • Under production: lost opportunity to produce
Evolution of Milk Supply and Demand Forecast includes a 1% growth allowance
CDC Seasonality Programs • While milk production is quite stable year round, people consume more dairy products in the fall/winter and less in the spring. • To offset this, the CDC buys and stores butter and skim milk powder in the spring and puts those products back in the market in the fall/winter. • These transactions are done at support prices.
Seasonality Programs - Butter • Plan A • Becomes the property of the CDC • 25 kg blocks • Plan B • Processors must buy back within one year of production of the product • One-pound prints ready for retail sales.
Managing Surpluses • Production is managed on a butterfat basis. • Surpluses of milk solids non fat (SNF) arise because consumers want the fat portion of the milk more than the SNF portion. • The CDC buys the surplus SNF and disposes of it by exporting it or selling it for animal feed. • Both these markets yield a lower return to producers than regular sales.
CDC Import / Export • IMPORTS • According to WTO (3,274 t) • Butter: sold to further processors • Cheese: private sector imports (20,412 t) • EXPORTS • Subsidized exports according to WTO limits (none to USA) • SMP (CDC exports to Cuba and Mexico) • Permits for private exporters including non-contingent classes
Pools were established in themid-1990’s in response to… • Increased concentration at the retail and processing levels • New trade rules (FTA, NAFTA, WTO) • Differing provincial policies (for ex. milk allocation to plants) • Fluid milk moving between provinces • Inequities in producer returns
The CDC administers 3 milk pools • The P10 (all 10 provinces) • The P5 (in the East) • The WMP (in the West) • These pools allow dairy farmers to share and balance revenues, markets and in some cases, transportation costs.
How Pools are Administered • Provinces report production and sales data (by milk class) monthly to the CDC. • The CDC calculates money transfers between members to equalize returns. • The CDC calculates quota allocation when demand changes. • The CDC keeps a bank account for pool operations.
Resulting in harmonization of… • Multiple component pricing • Producer prices • Milk classification • Quota policies • POOL = RISK MANAGEMENT TOOL
Current Issues • Increased imports and cross-border shopping • Harmonization issues within regional pools • Quota management • Audit rules • National all milk pool • Milk allocation to plants • Marketing/Innovation • Special Classes, Dairy Marketing Program and CDC Dairy Innovation Program • Trade negotiations • Focus market growth
Some observations on Trade • Several countries still have high budget expenditure for the milk sector • EU - €3,5 billion on average 2008-2011 • US – approx. $4 billion per year ($40 billion in the last decade) – New Farm Bill? • These subsidies contribute to depressed Pw • Trade agreements • WTO • CETA (additional cheese imports) • TPP ? • Producing milk in Northern hemisphere is more costly than in the Southern hemisphere
Increased focus on additional flexibility to grow the market • 1% permanent growth allowance for added flexibility in supply • Dairy Innovation Program • Skim Milk Redirection Program • Mozzarella market and fresh pizza - Class 3(d) • More flexible allocation policies (yogurt and fine cheeses) • On-going development of market of SNF • Reduce structural surplus • Opportunity to add value and increase returns to producers without increasing price to consumers
CDC GraduateScholarships • To ensurethat Canada has enoughspecialists in the areas of • Food and dairy sciences • Economics and policy(supplymgt.) • Animal science • CDC commitment: $3 million over 5 years • 70 M.Sc.’s and 25 Ph.D.’s • Renewed for the last time 2011-2016
QUESTIONS www.cdc-ccl.gc.ca www.dairyinfo.gc.ca www.milkingredients.ca