Download
1 / 83
901 likes | 1.73k Views
Price Elasticity Coefficient Formula. E d = % change in quantity demanded of product X % change in price of product X Calculating % change % Change in quantity = nqd – iqd initial quantity demanded

E N D
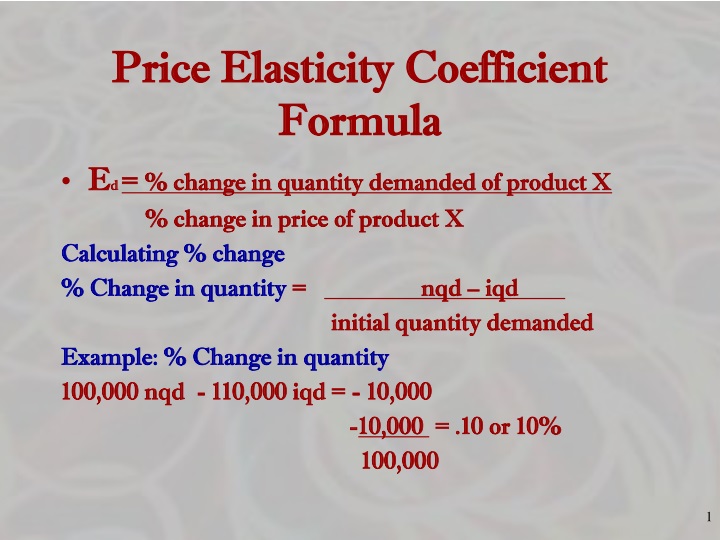
Price Elasticity Coefficient Formula • Ed = % change in quantity demanded of product X % change in price of product X Calculating % change % Change in quantity = nqd – iqd initial quantity demanded Example: % Change in quantity 100,000 nqd - 110,000 iqd = - 10,000 -10,000 = .10 or 10% 100,000
Price Elasticity Coefficient Formula • Ed = % change in quantity demanded of product X % change in price of product X • Change in price = New Price – Initial Price Initial price New Price = $4 Initial Price = $3 $4 np - $3 ip = $1 = .33 or 33% $3 ip $3
Price Elasticity Coefficient Formula • Ed = % change in quantity demanded of product X % change in price of product X 10% = .30 or 30% 33%
Chapter 6: Extensions of Supply, Demand, and Supply Analysis
Elasticity • It is all about how things respond to changes in prices • Responsive or not responsive
Supply and Demand Review • Define the Law of Demand • Define the Law of Supply • What is the difference between a change in demand and a change in quantity demanded? • What happens if price is above equilibrium? • What happens if price is below equilibrium? • Define Consumer’s and Producer’s Surplus • Identify the rule for double shifts in S&D • Explain the results of an excise tax
THE LAW OF DEMAND SAYS... Consumers will buy more when prices go down and less when prices go up HOW MUCH MORE OR LESS? DOES IT MATTER?
Elasticity Elasticity shows how sensitive quantity is to a change in price.
Summary of the Chapter • Paul Salmon Video - Elasticity
Goals Of This Chapter • By the end of this chapter you should be able to do the • Elasticity Slide
4 Types of Elasticity • Elasticity of Demand • Elasticity of Supply • Cross-Price Elasticity (Subs or Comp) • Income Elasticity (Norm or Inferior)
Total Revenue • Total revenue = total amount the seller receives from the sale of a product or service • In a particular time period • Formula TR = P * Q • TR = total revenue • P = Price • Q = quantity
Total Revenue • Formula TR = P X Q • TR = total revenue • P = Price • Q = quantity • Example • Price is $3.50 per gallon • Quantity = 10 gallons • $3.5 * 10 = $35 Total Revenue
What Happens If--- • What happens to total revenue if • Prices go up? • Prices go down? • We know about the Supply and Demand Curve • Does not tell us what happens if--- • Brings us to elasticity
Elasticity • Measure of the responsiveness of the quantity demanded to a good or service • To change in price • When all other factors remain the same
1. Elasticity of Demand • Elasticity of Demand- • Measurement of consumers responsiveness to a change in price. • What will happen if price increase? How much will it affect Quantity Demanded • Who cares? • Used by firms to help determine prices and sales • Used by the government to decide how to tax
Elasticity of Demand • In the previous section, supply and demand curves were drawn as straight lines. • This is a simplification, • we assume rate of change of demand or supply is the same for all prices in the market. • At some prices, a small change in price may • cause a large change in the quantity demanded.
Name--- • In the short run, name • Products whose price change will not change demand much • Products whose price change will change demand significantly
This shown in the diagram as the movement from Pe to Pe1; a small change in price which causes an even larger percentage decrease in quantity demanded (from Qe to Qe1. At other prices, a large increase in price may see a much smaller decrease in demand. This shown in the diagram as the movement from Pe2 to Pe3; a large change in price which causes a smaller percentage decrease in quantity demanded (from Qe2 to Qe3.
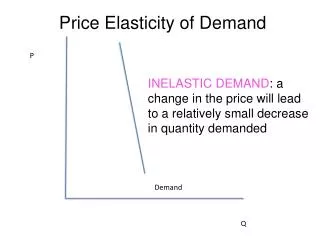
Inelastic Demand INelastic = Quantity is INsensitive to a change in price. • If price increases, quantity demanded will fall a little • If price decreases, quantity demanded increases a little. • In other words, people will continue to buy it. 20% 5% A INELASTIC demand curve is steep! (looks like an “I”) • Examples: • Gasoline • Milk • Diapers • Chewing Gum • Medical Care • Toilet paper
Inelastic Demand If percentage change in price produces a smaller percentage change in quantity demanded
Inelastic Demand • General Characteristics of INelastic Goods: • Few Substitutes • Necessities • Small portion of income • Required now, rather than later • Elasticity coefficient less than 1 20% 5%
Elastic Demand Elastic = Quantity is sensitive to a change in price. • If price increases, quantity demanded will fall a lot • If price decreases, quantity demanded increases a lot. • In other words, the amount people buy is sensitive to price. An ELASTIC demand curve is flat! • Examples: • Soda • Boats • Beef • Real Estate • Pizza • Gold
Elastic Demand • General Characteristics of Elastic Goods: • Many Substitutes • Luxuries • Large portion of income • Plenty of time to decide • Elasticity coefficient greater than 1
Price Elasticity Coefficient Formula • Ed = % change in quantity demanded of product X % change in price of product X Calculating % change % Change in quantity = nqd – iqd initial quantity demanded Example: % Change in quantity 100,000 nqd - 110,000 iqd = - 10,000 -10,000 = .10 or 10% 100,000
Price Elasticity Coefficient Formula • Ed = % change in quantity demanded of product X % change in price of product X • Change in price = New Price – Initial Price Initial price New Price = $4 Initial Price = $3 $4 np - $3 ip = $1 = .33 or 33% $3 ip $3
Price Elasticity Coefficient Formula • Ed = % change in quantity demanded of product X % change in price of product X 10% = .30 or 30% 33%
Graph • Graph the previous example • Is it elastic or inelastic? WHY? • Inelastic because change in % change in quantity demanded is less than % change in price • Or a 33% change in price created a 10% drop in quantity demanded • Calculated price elastic is < 1 therefore price is inelastic
You Solve • Decide the price elasticity of demand for a slice of pizza at $2.00 by examining a price decrease from $2.00 to $1.50 per slice. In this case, the demand pizza would increase from 7 million slices to 10 million slices. You can use these figures to calculate the price elasticity of demand
Ed= % change in quantity demanded of product X % change in price of product X • Ed = (10M – 7M) ÷ 7M (DN-O÷O) ($1.50 - $2.00) ÷ $2.00 (PN-O÷O) • Ed = .43 = -1.72 - 0.25 Drop the negative: Ed is > 1 therefore the demand for pizza slices is elastic
Negative Numbers • If price increases by 10% and consumers respond by decreasing purchases by 20% • the equation computes the elasticity coefficient as -2. • The result is negative because an increase in price (a positive number) • leads to a decrease in purchases (a negative number). • Because the law of demand says it will always be negative, many economists ignore the negative sign
Elastic or Inelastic? Beef- 1.27 Gasoline- .20 Real Estate- 1.6 Medical Care- .31 Electricity- .13 Gold- 2.6 Elastic INelastic Elastic INelastic INelastic Elastic What about the demand for insulin for diabetics? What if % change in quantity demanded equals % change in price? Perfectly INELASTIC (Coefficient = 0) Unit Elastic (Coefficient =1)
2. Price Elasticity of Supply • Elasticity of Supply- • Elasticity of supply shows how sensitiveproducers are to a change in price. • Elasticity of supply is based on time limitations. • Producers need time to produce more. • INelastic = Insensitive to a change in price (Steep curve) • Most goods have INelastic supply in the short-run • Elastic = Sensitive to a change in price (Flat curve) • Most goods have elastic supply in the long-run • Perfectly Inelastic = Q doesn’t change (Vertical line) • Set quantity supplied
Elasticity of supply is influenced by a number of factors. These include : • the length of the production period. In the late 1990's, demand for Australia wines overseas has reached all time records. Vines take three years to grow to a point where they yield adequate amounts of fruit. Increases in demand for Australian wine has seen prices rise (from Po to P1), and returns to existing grape growers are excellent. Those who wish to buy grapes face a market where supply can only increase marginally (from Qo to Q1), in the short term. • However, many new stands of vines are being planted, and in a few years, returns to growers may stabilise, as supply increases. Prices will fall from P1 to P2 as the supply of grapes increases from Q1 to Q2.
Price Elasticity of Supply Over Time • How would you graph the supply elasticity of Gas over time? • Lets see
3. Cross-Price Elasticity of Demand Cross-Price elasticity shows how sensitive a product is to a change in price of another good It shows if two goods are substitutes or complements % change in quantity of product “b” % change in price of product “a” P increases 20% Q decreases 15% • (test) If coefficient is negative (shows inverse relationship) then the goods are complements • If coefficient is positive (shows direct relationship) then the goods are substitutes
Think • Pizza and Burgers are elastic and substitutes of each other • If the price of pizza declines • 1. What happens to the sale of pizza? • 2. What happens to the sale of burgers? • 2. Soda is a compliment to pizza. What happens to the sale of soda? • Lets Graph
Income elasticity shows how sensitive a product is to a change in INCOME It shows if goods are normal or inferior 4. Income-Elasticity of Demand % change in quantity % change in income Income increases 20%, and quantity decreases 15% then the good is a… INFERIOR GOOD • (test) If coefficient is negative (shows inverse relationship) then the good is inferior • If coefficient is positive (shows direct relationship) then the good is normal • Ex: If income falls 10% and quantity falls 20%…
Total Revenue Test • Uses elasticity to show how changes in price will affect total revenue (TR). • (TR = Price x Quantity) • Elastic Demand- • Price increase causes TR to decrease • Price decrease causes TR to increase • Inelastic Demand- • Price increase causes TR to increase • Price decrease causes TR to decrease • Unit Elastic- • Price changes and TR remains unchanged • Ex: If demand for milk is INelastic, what will happen to expenditures on milk if price increases?
Is the range between A and B, elastic, inelastic, or unit elastic? 10 x 100 =$1000 Total Revenue 5 x 225 =$1125 Total Revenue A Price decreased and TR increased, so… Demand is ELASTIC 50% B 125%
You Should Now Get This • Elastic and Inelastic Demand Baby • Winner 2013 Econ video contest
Total Revenue Test }inelastic } unit elastic }elastic