Download
1 / 2
20 likes | 181 Views
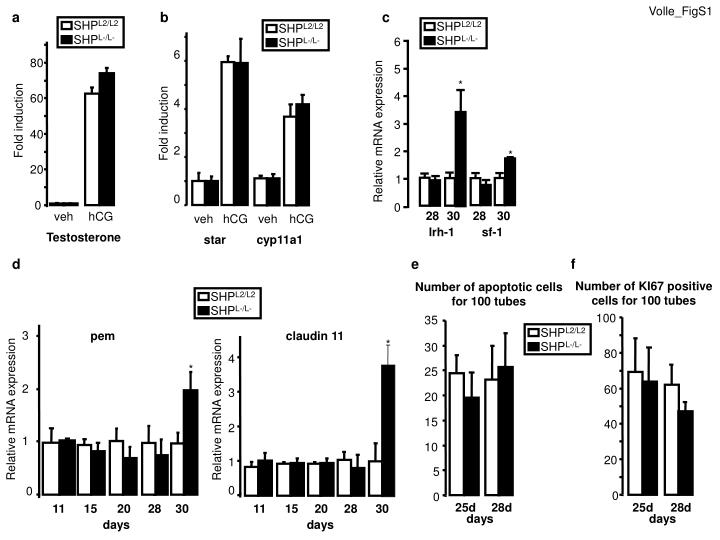
Volle_FigS1. SHP L2/L2. SHP L2/L2. SHP L2/L2. SHP L2/L2. SHP L2/L2. SHP L-/L-. SHP L-/L-. SHP L-/L-. SHP L-/L-. SHP L-/L-. a. b. c. 6. 6. 80. 5. *. 4. 60. 4. Relative mRNA expression. Fold induction. Fold induction. 3. 40. 2. *. 2. 20. 1. 0. 0. 0. 28. 30. 28.

E N D
Volle_FigS1 SHPL2/L2 SHPL2/L2 SHPL2/L2 SHPL2/L2 SHPL2/L2 SHPL-/L- SHPL-/L- SHPL-/L- SHPL-/L- SHPL-/L- a b c 6 6 80 5 * 4 60 4 Relative mRNA expression Fold induction Fold induction 3 40 2 * 2 20 1 0 0 0 28 30 28 30 veh hCG veh hCG veh hCG lrh-1 sf-1 Testosterone star cyp11a1 d e f Number of KI67 positive cells for 100 tubes Number of apoptotic cells for 100 tubes 100 35 pem claudin 11 3 * 30 80 4 * 25 2 60 3 Relative mRNA expression 20 Relative mRNA expression 15 40 2 1 10 20 1 5 0 0 0 0 25d 28d 25d 28d 11 15 20 28 30 11 15 20 28 30 days days days days
Volle_FigS2 SHPL2/L2 SHPL-/L- a SacI HindIII SacI HindIII SacI Genomic locus 1 2 1 2 neo pBS pBS Targeting vector SacI SacI HindIII SacI L3 1 2 neo L2 1 2 HindIII HindIII SacI Deleted allele (L-) c b L2/L2 L2/L- L-/L- 2 Relative mRNA expression 1 500pb 400pb 300pb 0 Liver Testis