Download
1 / 20
210 likes | 367 Views
Using and Reporting Measures of Effect Size. Roger E. Kirk Department of Psychology & Neuroscience Baylor University. Three Categories of Measures of Effect Magnitude. 1. Measures of effect size (typically, standardized mean differences) 2. Measures of strength of association

E N D
Using and Reporting Measures of Effect Size Roger E. Kirk Department of Psychology & Neuroscience Baylor University
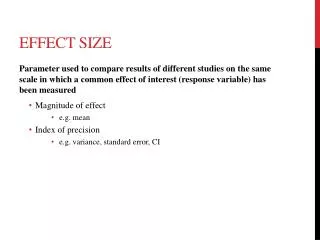
Three Categories of Measures of Effect Magnitude 1. Measures of effect size (typically, standardized mean differences) 2. Measures of strength of association 3. A large category of other kinds of measures 2
Four Purposes of Measures of Effect Magnitude 1. Estimate the sample size required to achieve an acceptable power 2. Integrate the results of empirical research studies in meta-analyses 3. Supplement the information provided by null hypothesis significance tests 4. Determine whether research results are practically significant 3
Four Criticisms of Null Hypothesis Significance Testing 1. Answers the wrong question What we want to know is the probability that the null hypothesis is true, given our data: Null hypothesis significance testing tells us the probability of obtaining our data or more extreme data if the null hypothesis is true: 4
Four Criticisms of Null Hypothesis Significance Testing (continued) 2. Is a trivial exercise According to John Tukey “the effects of A and B are always different—in some decimal place—for any A and B. Thus asking ‘Are the effects different?’ is foolish.” 5
Four Criticisms of Null Hypothesis Significance Testing (continued) According to Bruce Thompson “Statistical testing becomes a tautological search for enough participants to achieve statistical significance. If we fail to reject, it is only because we have been too lazy to drag in enough participants” 6
Four Criticisms of Null Hypothesis Significance Testing (continued) 3. Requires us to make a dichotomous decision from a continuum of uncertainty The adoption of .05 as as the dividing point between significance and non-significance is quite arbitrary. 7
Four Criticisms of Null Hypothesis Significance Testing(continued) 4. Does not address the question of whether results are important, valuable, or useful: that is, their practical significance. 8
Three Basic Questions that Researchers Want to Answer from Their Research Is an observed effect real or should it be attributed to chance? 2. If the effect is real, how large is it? 3. Is the effect large enough to be useful? 9
Recommendation of the APA Publication Manual “Because confidence intervals combine information on location and precision and can often be used to infer significance levels, they are, in general the best reporting strategy . . . Multiple degree-of-freedom indicators are often less useful than effect-size indicators that decompose multiple degree-of-freedom tests into one degree-of-freedom effects . . . 10
Effect size (1) Cohen’s Three ways to estimate Cohen Glass Hedges 11
Guidelines for Interpreting = 0.2 is a small effect = 0.5 is a medium effect = 0.8 is a large effect 12
Strength of Association (1) Sample estimators of omega squared and the intraclass correlation 13
Guidelines for Interpreting Omega Squared = .001 is a small association = .059 is a medium association = .138 is a large association 14
Measures of Effect Magnitude ________________________________________________________________ Effect Size Strength of Association Other Measures _______________________________________________________________ Cohen d, f, g, h,q, Glass g’ Hedges g Mahalanobis D Mean1 – Mean2 Mdn1– Mdn2 Mode1– Mode2 Rosenthal Tang Thompson d* Wilcox r, rpb, r2, R, R2,,, f2 Chamber re Cohen f2 Contingency coef C Cramér V Fisher Z Friedman rm Goodman Herzberg R2 Kelly Abs. risk reduction ARR Cliff p Cohen U1, U2, U3 Shift function Dunlap CLR Grisson PS Logit d’ McGraw & Wong CL Odds ratio Preece ratio of success Probit d’ Relative risk RR Sánchez-Meca dCox 15
More Measures of Effect Magnitude ________________________________________________________________ Effect Size Strength of Association Other Measures _______________________________________________________________ Wilcox & Muska Rosenthal & Rubin BESD Rosenthal & Rubin EScounter null Wilcoxon Kendall W Lord R2 Olejnik requivalent ralerting rcontrast reffect size Tatsuoka Wherry R2 16
Two Ways to Estimate the Denominator of Cohen’s (1) (2) 17
Effect of the Unreliability of the Dependent Variable, Y, On the Proportion of Explained Variance 18
Double-Blind Study of 22,071 Men Physicians Aspirin group pA = .01259 Placebo group pP= .02166 pA– pP = .01259 – .02166 = –.009 19
THE END 20