Download
1 / 1
10 likes | 88 Views
By Greg Files.

E N D
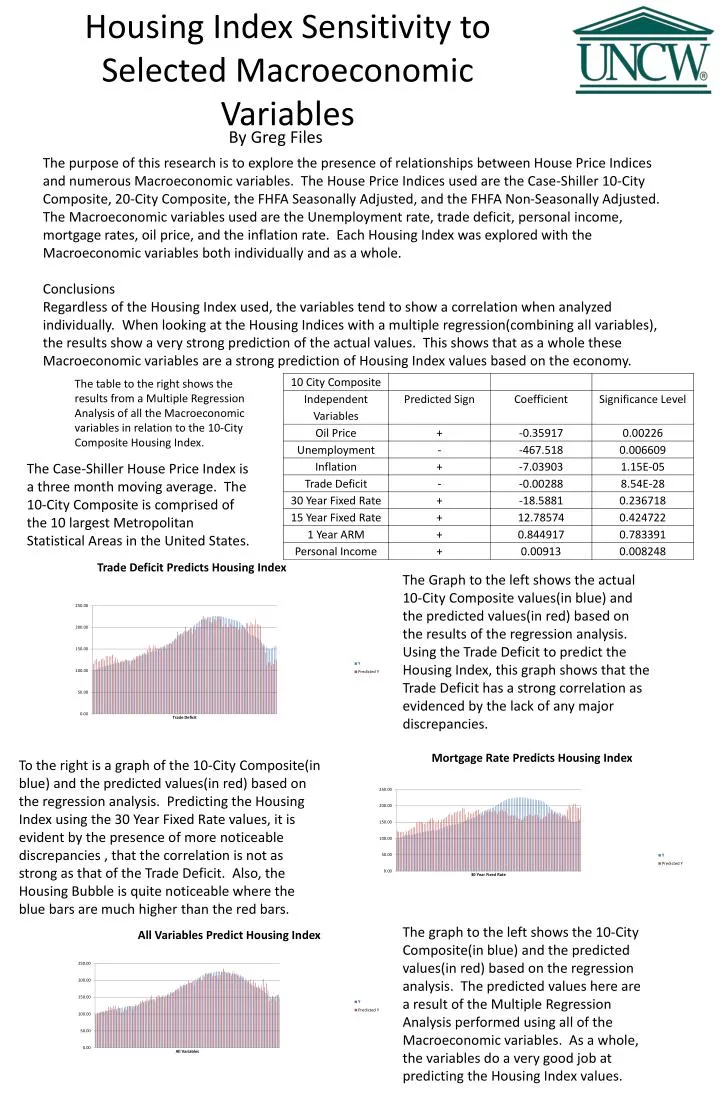
By Greg Files The purpose of this research is to explore the presence of relationships between House Price Indices and numerous Macroeconomic variables. The House Price Indices used are the Case-Shiller 10-City Composite, 20-City Composite, the FHFA Seasonally Adjusted, and the FHFA Non-Seasonally Adjusted. The Macroeconomic variables used are the Unemployment rate, trade deficit, personal income, mortgage rates, oil price, and the inflation rate. Each Housing Index was explored with the Macroeconomic variables both individually and as a whole. Conclusions Regardless of the Housing Index used, the variables tend to show a correlation when analyzed individually. When looking at the Housing Indices with a multiple regression(combining all variables), the results show a very strong prediction of the actual values. This shows that as a whole these Macroeconomic variables are a strong prediction of Housing Index values based on the economy. Housing Index Sensitivity to Selected Macroeconomic Variables The table to the right shows the results from a Multiple Regression Analysis of all the Macroeconomic variables in relation to the 10-City Composite Housing Index. The Case-Shiller House Price Index is a three month moving average. The 10-City Composite is comprised of the 10 largest Metropolitan Statistical Areas in the United States. The Graph to the left shows the actual 10-City Composite values(in blue) and the predicted values(in red) based on the results of the regression analysis. Using the Trade Deficit to predict the Housing Index, this graph shows that the Trade Deficit has a strong correlation as evidenced by the lack of any major discrepancies. To the right is a graph of the 10-City Composite(in blue) and the predicted values(in red) based on the regression analysis. Predicting the Housing Index using the 30 Year Fixed Rate values, it is evident by the presence of more noticeable discrepancies , that the correlation is not as strong as that of the Trade Deficit. Also, the Housing Bubble is quite noticeable where the blue bars are much higher than the red bars. The graph to the left shows the 10-City Composite(in blue) and the predicted values(in red) based on the regression analysis. The predicted values here are a result of the Multiple Regression Analysis performed using all of the Macroeconomic variables. As a whole, the variables do a very good job at predicting the Housing Index values.