Download
1 / 25
250 likes | 386 Views
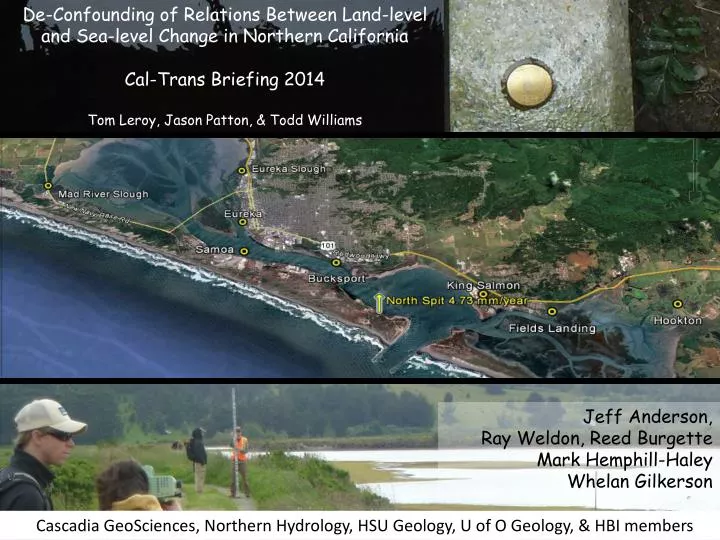
De-Confounding of Relations Between Land-level and Sea-level Change in Northern California Cal-Trans Briefing 2014 Tom Leroy, Jason Patton, & Todd Williams. Jeff Anderson, Ray Weldon, Reed Burgette Mark Hemphill-Haley Whelan Gilkerson.

E N D
De-Confounding of Relations Between Land-level and Sea-level Change in Northern California Cal-Trans Briefing 2014 Tom Leroy, Jason Patton, & Todd Williams Jeff Anderson, Ray Weldon, Reed Burgette Mark Hemphill-Haley Whelan Gilkerson Cascadia GeoSciences, Northern Hydrology, HSU Geology, U of O Geology, & HBI members
Humboldt Bay Vertical Reference Group • US. Fish and Wildlife Service • Northern Hydrology • Pacific Watershed Associates • Humboldt State University • University of Oregon
Variables that determine locally observed sea level • Eustatic (global water volume changes) • Tectonic (land-level changes) • Sediment Accretion (local sediment deposition)
Variables that determine locally observed sea level • Eustatic (global water volume changes) • Tectonic (land-level changes) • Sediment Accretion (local sediment deposition)
Tectonic forces in Northern California are primarily driven by the Cascadia subduction zone
Bathymetry,topography, and primary faults of the Cascadia subduction zone 52Ê52Ê50Ê50Ê48Ê48Ê46Ê46Ê44Ê44Ê42Ê42Ê40Ê40Ê240Ê238Ê236Ê236Ê234Ê234Ê232Ê232Ê
Interseismic (between earthquakes) Coseismic (during earthquake) Atwater & Satake, 2009
Why is this important? This demonstrates the elastic nature of the crust. The sense of motion for interseismic and coseismic land level changes are inverted.
other deformation estimates for Cascadia Flück, et al., 1997 Wang, et al., 2003
How can we determine the spatial distribution of vertical land level change? • Tide gage analysis • Historic level survey analysis
Historic Tide Gage Locations Humboldt Bay 1977 - 2014
HBV Tide Gage Deployment Locations • 2013-2014 • Mad River Slough • Eureka (Chevron Dock) • Hookton Slough
Additional Records • 1978-2014 • NOAA • North Spit • 2010 • US ACOE • Fields Landing • Samoa
Monthly Mean Sea Level (Station Datum, mm) plotted vs. Time • Mad River Slough Relative to CC • Mad River Slough subsides relative to Crescent City at 4.2mm/yr. • North Spit Relative to CC • North Spit subsides relative to Crescent City at 5.4 mm/yr. • Hookton Slough Relative to CC • Hookton Slough subsides relative to Crescent City at 6.8 mm/yr. * assumes 2.28 mm/yr SLR
Historic Leveling, Humboldt Bay 1931: San Jose – Eureka 1931: Eureka – Grants Pass 1944: Arcata – North Spit 1967: Longvale – Crescent City 1988: Eureka – Redding 1988: Westport – Arcata – North Spit 1992: Garberville – Loleta 2004: State Hwy – Countywide GPS Source: NGS Integrated Database; compiled by Don Campbell, CalTrans Dist. 1, 2010. ~ 70 control points surveyed from 1931-1992 ~ 40 observed either 1944-1967 or 1967-1988 ~ 20 observed 1944-1988
Land level Change (mm/yr) * assumes 2.28 mm/yr SLR -1.18 • Land level – Tide Gage Misfit • Site(mm/yr) • CC 0.69 ± 0.38 • MRS 0.40 ± 0.20 • NS 0.31 ± 0.36 • HS 0.10 ± 0.51 -2.38 -3.58
Future Projects and Objectives: Campaign Tide Gage – densify network of tide gages in Humboldt Bay to better understand the spatial variation in vertical deformation. Continuous GPS collocated with tide gages – to continuously tie the tide gage water surface elevation data to the tide gage station datum; to provide independent measure of vertical land level change Permanent Tide Gage at Hookton Slough – to better model higher order controls on sea level (meteorological, storms, ENSO, etc.) Repeated Level Surveys Around Humboldt Bay – to better understand the spatial variation in vertical deformation Geodetic Modeling– build a predictive model for estimates of vertical motion between benchmarks and tide gages Sediment Coring – to characterize the prehistoric record of Paleodeformation