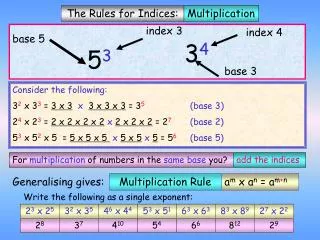
Download
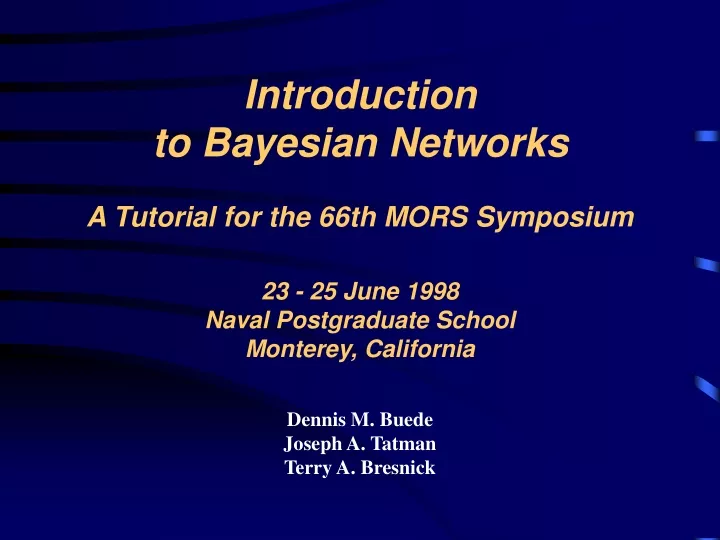
1 / 75
750 likes | 761 Views
Explore the basics, operations, propagation algorithms, learning, and applications of Bayesian networks in decision aids, data fusion, and more.

E N D
Introduction to Bayesian NetworksA Tutorial for the 66th MORS Symposium23 - 25 June 1998Naval Postgraduate SchoolMonterey, California Dennis M. Buede Joseph A. Tatman Terry A. Bresnick
Overview • Day 1 • Motivating Examples • Basic Constructs and Operations • Day 2 • Propagation Algorithms • Example Application • Day 3 • Learning • Continuous Variables • Software
Day One Outline • Introduction • Example from Medical Diagnostics • Key Events in Development • Definition • Bayes Theorem and Influence Diagrams • Applications
Why the Excitement? • What are they? • Bayesian nets are a network-based framework for representing and analyzing models involving uncertainty • What are they used for? • Intelligent decision aids, data fusion, 3-E feature recognition, intelligent diagnostic aids, automated free text understanding, data mining • Where did they come from? • Cross fertilization of ideas between the artificial intelligence, decision analysis, and statistic communities • Why the sudden interest? • Development of propagation algorithms followed by availability of easy to use commercial software • Growing number of creative applications • How are they different from other knowledge representation and probabilistic analysis tools? • Different from other knowledge-based systems tools because uncertainty is handled in mathematically rigorous yet efficient and simple way • Different from other probabilistic analysis tools because of network representation of problems, use of Bayesian statistics, and the synergy between these
Example from Medical Diagnostics • Network represents a knowledge structure that models the relationship between medical difficulties, their causes and effects, patient information and diagnostic tests Visit to Asia Smoking Patient Information Tuberculosis Lung Cancer Bronchitis Medical Difficulties Tuberculosis or Cancer XRay Result Dyspnea Diagnostic Tests
Tuber Present Present Absent Absent Lung Can Present Absent Present Absent Tub or Can True True True False Dyspnea Medical Difficulties Tub or Can True True False False Bronchitis Present Absent Present Absent Present 0.90 0.70 0.80 0.10 Absent 0.l0 0.30 0.20 0.90 Example from Medical Diagnostics • Relationship knowledge is modeled by deterministic functions, logic and conditional probability distributions Visit to Asia Smoking Patient Information Tuberculosis Lung Cancer Bronchitis Tuberculosis or Cancer XRay Result Dyspnea Diagnostic Tests
Example from Medical Diagnostics • Propagation algorithm processes relationship information to provide an unconditional or marginal probability distribution for each node • The unconditional or marginal probability distribution is frequently called the belief function of that node
Example from Medical Diagnostics • As a finding is entered, the propagation algorithm updates the beliefs attached to each relevant node in the network • Interviewing the patient produces the information that “Visit to Asia” is “Visit” • This finding propagates through the network and the belief functions of several nodes are updated
Example from Medical Diagnostics • Further interviewing of the patient produces the finding “Smoking” is “Smoker” • This information propagates through the network
Example from Medical Diagnostics • Finished with interviewing the patient, the physician begins the examination • The physician now moves to specific diagnostic tests such as an X-Ray, which results in a “Normal” finding which propagates through the network • Note that the information from this finding propagates backward and forward through the arcs
Example from Medical Diagnostics • The physician also determines that the patient is having difficulty breathing, the finding “Present” is entered for “Dyspnea” and is propagated through the network • The doctor might now conclude that the patient has bronchitis and does not have tuberculosis or lung cancer
Industrial Processor Fault Diagnosis - by Intel Auxiliary Turbine Diagnosis - GEMS by GE Diagnosis of space shuttle propulsion systems - VISTA by NASA/Rockwell Situation assessment for nuclear power plant - NRC Military Automatic Target Recognition - MITRE Autonomous control of unmanned underwater vehicle - Lockheed Martin Assessment of Intent Medical Diagnosis Internal Medicine Pathology diagnosis - Intellipath by Chapman & Hall Breast Cancer Manager with Intellipath Commercial Financial Market Analysis Information Retrieval Software troubleshooting and advice - Windows 95 & Office 97 Pregnancy and Child Care - Microsoft Software debugging - American Airlines’ SABRE online reservation system Applications
Definition of a Bayesian Network • Factored joint probability distribution as a directed graph: • structure for representing knowledge about uncertain variables • computational architecture for computing the impact of evidence on beliefs • Knowledge structure: • variables are depicted as nodes • arcs represent probabilistic dependence between variables • conditional probabilities encode the strength of the dependencies • Computational architecture: • computes posterior probabilities given evidence about selected nodes • exploits probabilistic independence for efficient computation
X1 X2 X3 X5 X6 X4 p(x1, x2, x3, x4, x5, x6) = p(x6 | x5) p(x5 | x3, x2) p(x4 | x2, x1) p(x3 | x1) p(x2 | x1) p(x1) Sample Factored Joint Distribution
Bayes Rule • Based on definition of conditional probability • p(Ai|E) is posterior probability given evidence E • p(Ai) is the prior probability • P(E|Ai) is the likelihood of the evidence given Ai • p(E) is the preposterior probability of the evidence A2 A3 A4 A1 p(A, B) p(B | A)p(A) = = p(A | B) p(B) p(B) E A6 A5 p(E | A )p(A ) p(E | A )p(A ) = = i i i i p(A | E) å i p(E) p(E | A )p(A ) i i i
X1 X1 X2 X2 X3 X3 X1 X2 X1 X2 X3 X3 Arc Reversal - Bayes Rule p(x1, x2, x3) = p(x3| x1) p(x2 | x1) p(x1) p(x1, x2, x3) = p(x3 | x2, x1) p(x2) p( x1) is equivalent to is equivalent to p(x1, x2, x3) = p(x3, x2 | x1) p( x1) = p(x2 | x3, x1) p(x3 | x1) p( x1) p(x1, x2, x3) = p(x3 | x1) p(x2 , x1) = p(x3 | x1) p(x1 | x2) p( x2)
Inference Using Bayes Theorem Bronchitis Lung Cancer Bronchitis Tuber- culosis Lung Cancer Tuberculosis or Cancer Tuberculosis or Cancer Dyspnea Dyspnea Lung Cancer Lung Cancer Lung Cancer Tuberculosis or Cancer Dyspnea Dyspnea Dyspnea The general probabilistic inference problem is to find the probability of an event given a set of evidence This can be done in Bayesian nets with sequential applications of Bayes Theorem
Why Not this Straightforward Approach? • Entire network must be considered to determine next node to remove • Impact of evidence available only for single node, impact on eliminated nodes is unavailable • Spurious dependencies between variables normally perceived to be independent are created and calculated • Algorithm is inherently sequential, unsupervised parallelism appears to hold most promise for building viable models of human reasoning • In 1986 Judea Pearl published an innovative algorithm for performing inference in Bayesian nets that overcomes these difficulties - TOMMORROW!!!!
Overview • Day 1 • Motivating Examples • Basic Constructs and Operations • Day 2 • Propagation Algorithms • Example Application • Day 3 • Learning • Continuous Variables • Software
Introduction to Bayesian NetworksA Tutorial for the 66th MORS Symposium23 - 25 June 1998Naval Postgraduate SchoolMonterey, California Dennis M. Buede Joseph A. Tatman Terry A. Bresnick
Overview • Day 1 • Motivating Examples • Basic Constructs and Operations • Day 2 • Propagation Algorithms • Example Application • Day 3 • Learning • Continuous Variables • Software
Overview of Bayesian Network Algorithms • Singly vs. multiply connected graphs • Pearl’s algorithm • Categorization of other algorithms • Exact • Simulation
Propagation Algorithm Objective • The algorithm’s purpose is “… fusing and propagating the impact of new evidence and beliefs through Bayesian networks so that each proposition eventually will be assigned a certainty measure consistent with the axioms of probability theory.” (Pearl, 1988, p 143) Data Data
Singly Connected Networks(or Polytrees) Definition : A directed acyclic graph (DAG) in which only one semipath (sequence of connected nodes ignoring direction of the arcs) exists between any two nodes. Multiple parents and/or multiple children Polytree structure satisfies definition Do not satisfy definition
Notation X = a random variable (a vector of dimension m); x = a possible value of X e = evidence (or data), a vector of dimension m My|x = p(y|x), the likelihood matrix or conditional probability distribution y p(y1|x1) p(y2|x1) . . . p(yn|x1) p(y1|x2) p(y2|x2) . . . p(yn|x2) . . . . . . . . . p(y1|xm) p(y2|xm) . . . p(yn|xm) = x • Bel (x) = p(x|e), the posterior (a vector of dimension m) • f(x) g(x) = the term by term product (congruent multiplication) of two • vectors, each of dimension m • f(x) g(x) = the inner (or dot) product of two vectors, or the matrix • multiplication of a vector and a matrix • = a normalizing constant, used to normalize a vector so that its elements sum to 1.0
e+ Each node transmits a pi message to its children and a lambda message to its parents. Bel(Y) = p(y|e+, e-) = (y)T (y) where (y) = p(y|e+), prior evidence; a row vector (y) = p(e-|y), diagnostic or likelihood evidence; a column vector (y) = x p(y|x, e+) p(x| e+) = x p(y|x) (x) = (x) My|x (y) = z p(e-|y, z) p(z| y) = z p(e-|z) p(z| y) = z (z) p(z| y) = Mz|y (z) • (e+) X • (y) • (x) Y • (y) • (z) Z • (e-) e- Bi-Directional Propagation in a Chain
Strategic Mission Paris Med. [ ] .8 .2 .1 .9 Chalons Dijon Tactical Objective [ ] .5 .4 .1 .1 .3 .6 North Central South Avenue of Approach An Example: Simple Chain p(Paris) = 0.9 p(Med.) = 0.1 M TO|SM = M AA|TO = Ch Di Pa Me No Ce So Ch Di
Strategic Mission [ ] .8 .2 .1 .9 Tactical Objective [ ] .5 .4 .1 .1 .3 .6 Avenue of Approach Sample Chain - Setup (1) Set all lambdas to be a vector of 1’s; Bel(SM) = (SM) (SM) (SM) Bel(SM) (SM) Paris 0.9 0.9 1.0 Med. 0.1 0.1 1.0 (2) (TO) = (SM) MTO|SM; Bel(TO) = (TO) (TO) (TO) Bel(TO) (TO) Chalons 0.73 0.73 1.0 Dijon 0.27 0.27 1.0 (3) (AA) = (TO) MAA|TO; Bel(AA) = (AA) (AA) (AA) Bel(AA) (AA) North 0.39 0.40 1.0 Central 0.35 0.36 1.0 South 0.24 0.24 1.0 MAA|TO = MTO|SM =
Intel. Rpt. Strategic Mission Tactical Objective Avenue of Approach Troop Rpt. Sample Chain - 1st Propagation t = 0 t = 1 (SM) = (IR) (SM) Bel(SM) (SM) Paris 0.8 0.8 1.0 Med. 0.2 0.2 1.0 (TO) Bel(TO) (TO) Chalons 0.73 0.73 1.0 Dijon 0.27 0.27 1.0 (AA) Bel(AA) (AA) North 0.39 0.3 0.5 Central 0.35 0.5 1.0 South 0.24 0.2 0.6 t = 1 (AA) = (TR) [ ] p (lR) = .8 .2 = t 0 [ ] T l = ( TR ) . 5 1 .6
Intel. Rpt. Strategic Mission Tactical Objective Avenue of Approach Troop Rpt. Sample Chain - 2nd Propagation t = 0 (SM) Bel(SM) (SM) Paris 0.8 0.8 1.0 Med. 0.2 0.2 1.0 t = 2 (TO) = (SM) MTO|SM (TO) Bel(TO) (TO) Chalons 0.66 0.66 0.71 Dijon 0.34 0.34 0.71 t = 2 (TO) = MAA|TO (SM) (AA) Bel(AA) (AA) North 0.39 0.3 0.5 Central 0.35 0.5 1.0 South 0.24 0.2 0.6 [ ] p (lR) = .8 .2 = t 0 T [ ] l = ( TR ) . 5 1 .6
Intel. Rpt. Strategic Mission Tactical Objective Avenue of Approach Troop Rpt. Sample Chain - 3rd Propagation (SM) Bel(SM) (SM) Paris 0.8 0.8 0.71 Med. 0.2 0.2 0.71 t = 3 (SM) = MTO|SM(TO) (TO) Bel(TO) (TO) Chalons 0.66 0.66 0.71 Dijon 0.34 0.34 0.71 t = 3 (AA) = (TO) MAA|TO (AA) Bel(AA) (AA) North 0.36 0.25 0.5 Central 0.37 0.52 1.0 South 0.27 0.23 0.6
Internal Structure of a Single Node Processor Processor for Node X Message to Parent U Message from Parent U X(U) X(U) MX|U MX|U (X) (X) kk(X) BEL = BEL(X) 1(X) BEL(X) N(X) ... ... 1(X) N(X) 1(X) N(X) Message from Children of X Message to Children of X
“The impact of each new piece of evidence is viewed as a perturbation that propagates through the network via message-passing between neighboring variables . . .” (Pearl, 1988, p 143` PropagationExample • The example above requires five time periods to reach equilibrium after the introduction of data (Pearl, 1988, p 174) Data Data
Exact algorithms on original directed graph (only singly connected, e.g., Pearl) on related undirected graph Lauritzen & Spiegelhalter Jensen Symbolic Probabilistic Inference on a different but related directed graph using conditioning using node reductions Categorization of Other Algorithms • Simulation algorithms • Backward sampling • Stochastic simulation • Forward sampling • Logic sampling • Likelihood weighting • (With and without importance sampling) • (With and without Markov blanket scoring)
Decision Making in Nuclear Power Plant Operations Monitor Environment • “Decision making in nuclear power plant operations is characterized by: • Time pressure • Dynamically evolving scenarios • High expertise levels on the part of the operators Situation Assessment (SA) Decision Making Start Assessment ? 1) Monitor the environment 2) Determine the need for situation assessment 3) Propagate event cues 4) Project Events 5) Assess Situation 6) Make Decision Project Events Propagate Evidence Situation Awareness Updated Situation Belief Distribution Assess Situation Action Required ? Choose Action If Situation = Si Then Procedure = Pi
Model of Situation Assessment andHuman Decision Making • The Bayesian net situation assessment model provides: • Knowledge of the structural relationship among situations, events, and event cues • Means of integrating the situations and events to form a holistic view of their meaning • Mechanism for projecting future events Emergency Situations Steam Generator Tube Rupture Loss of Coolant Accident Loss of Secondary Coolant Other Events Steam Line Radiation Pressurizer Pressure Steam Gen- erator Level Sensor Outputs Steam Line Radiation Alarm Pressurizer Indicator Steam Generator Indicator
Situation Assessment Bayesian NetInitial Conditions Given Emergency
Situation Assessment Bayesian NetSteam Line Radiation Alarm Goes High
Situation Assessment Bayesian NetSteam Line Radiation Alarm Goes Low
Simulation of SGTR ScenarioConvergence of Situation Disparity • Situation Disparity is defined as follows: • SD(t) = | Bel (S(t)) - Bel(S’(t)) | • S represents the actual situation • S’ represents the perceived situation
Overview • Day 1 • Motivating Examples • Basic Constructs and Operations • Day 2 • Propagation Algorithms • Example Application • Day 3 • Learning • Continuous Variables • Software
Introduction to Bayesian NetworksA Tutorial for the 66th MORS Symposium23 - 25 June 1998Naval Postgraduate SchoolMonterey, California Dennis M. Buede, dbuede@gmu.edu Joseph A. Tatman, jatatman@aol.com Terry A. Bresnick, bresnick@ix.netcom.com http://www.gmu.edu - Depts (Info Tech & Eng) - Sys. Eng. - Buede
Overview • Day 1 • Motivating Examples • Basic Constructs and Operations • Day 2 • Propagation Algorithms • Example Application • Day 3 • Learning • Continuous Variables • Software
Building BN Structures Problem Domain Bayesian Network Probability Elicitor Expert Knowledge Problem Domain Bayesian Network Learning Algorithm Training Data Problem Domain Bayesian Network Learning Algorithm Expert Knowledge Training Data
Learning Probabilities from Data • Exploit conjugate distributions • Prior and posterior distributions in same family • Given a pre-defined functional form of the likelihood • For probability distributions of a variable defined between 0 and 1, and associated with a discrete sample space for the likelihood • Beta distribution for 2 likelihood states (e.g., head on a coin toss) • Multivariate Dirichlet distribution for 3+ states in likelihood space
Beta Distribution G (n) - - - = - m 1 n m 1 p (x | m, n) x (1 x) Beta G G - (m) (n m) m = mean n - m(1 m/n) = variance + n(n 1)
Multivariate Dirichlet Distribution N å G ( m ) i - - = m 1 m 1 m - 1 = i 1 p (x | m , m ,..., m ) x x ...x N 1 2 Dirichlet 1 2 N G G G (m ) (m )... (m ) 1 2 N m = th i mean of the i state N å m i = i 1 N å - m (1 m / m ) i i i = th = i 1 variance of the i state N N å å + m ( m 1) i i = = i 1 i 1
Updating with Dirichlet • Choose prior with m1 = m2 = … = mN = 1 • Assumes no knowledge • Assumes all states equally likely: .33, .33, .33 • Data changes posterior most quickly • Setting mi = 101 for all i would slow effect of data down • Compute number of records in database in each state • For 3 state case: • 99 records in first state, 49 in second, 99 in third • Posterior values of m’s: 100, 50, 100 • Posterior probabilities equal means: .4, .2, .4 • For mi equal 101, posterior probabilities would be: .36, .27, .36
Entropy Methods Earliest method Formulated for trees and polytrees Conditional Independence (CI) Define conditional independencies for each node (Markov boundaries) Infer dependencies within Markov boundary Score Metrics Most implemented method Define a quality metric to maximize Use greedy search to determine the next best arc to add Stop when metric does not increase by adding an arc Simulated Annealing & Genetic Algorithms Advancements over greedy search for score metrics Learning BN Structure from Data