Download

1 / 22
220 likes | 337 Views
Welcome to MM207 - Statistics!. To resize your pods: Place your mouse here. Left mouse click and hold. Drag to the right to enlarge the pod. Unit 2 Seminar Monday 8:00 – 9:00 pm ET Professor: Dan Watson Good Evening Everyone!. To maximize chat, minimize roster by clicking here.

E N D
Welcome to MM207 - Statistics! To resize your pods: Place your mouse here. Left mouse click and hold. Drag to the right to enlarge the pod. Unit 2 Seminar Monday 8:00 – 9:00 pm ET Professor: Dan Watson Good Evening Everyone! To maximize chat, minimize roster by clicking here
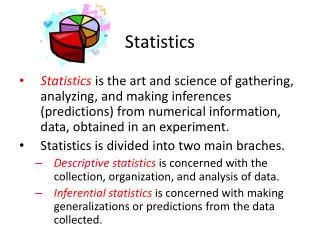
Organizing Data: Graphs and Tables • Common GraphsHistogram Circle graphs (Pie chart)Bar graphs Time series graphPareto chart Stem-and-leaf plot • Excel templates for creating Histograms and Pie Char https://docs.google.com/leaf?id=0B0ucIB81tO7DYjg0YjQzNDAtMDA2Yy00YzMzLWE1NzAtMTdlMjQ3OTJkY2Nm&sort=name&layout=list&num=50 • Additional resources available in the classroom by clicking on: Unit 11 -> Web Resources Analysis Toolpak Histogram Add-in
Creating a Histogram in Excel Enter in Left and Right Endpoints for Classes Calculate Midpoint by using the formula =(A4+B4)/2. Copy this cell (ctrl+c), Highlight the remaining midpoint cells and select paste (ctrl+v).
Creating a Histogram in Excel Enter in Frequency for Column D Calculate Relative Frequency by using the formula =(D4)/50. Copy this cell (ctrl+c), Highlight the remaining relative frequency cells and select paste (ctrl+v).
Creating a Histogram in Excel Click on ‘Insert’ -> ‘Chart’ -> ‘Column’ Highlight the Frequency and select appropriate histogram
Creating a Histogram in Excel To set the x axis, right click on the chart and select ‘Select Data’, click on ‘Category (x) axis labels, and highlight the Midpoints
Creating a Histogram in Excel To make the bars touch each other, right click on one of the bars and select ‘Format Data Series’ Set the Gap Width to 0%
Creating a Histogram in Excel Finished Product! -> Copy and Paste Histogram into your Word Document
Creating a Pie Chart in Excel Creating a Pie Chart is the same procedure Click on ‘Insert’ -> ‘Chart’ -> ‘Pie’
Mode, Median, and Mean Summary • Mean: The mean is the arithmetic average of the data set. (page 67) • Median: The median is the central value of an ordered data set. (page 68) • Mode: The mode of a data set is the value that occurs most frequently. (page 69)
Mode, Median, and Mean Summary • Mean: The mean is the arithmetic average of the data set. (page 67)
Mode, Median, and Mean Summary • Median: The median is the central value of an ordered data set. (page 68)
Mode, Median, and Mean Summary • Mode: The mode of a data set is the value that occurs most frequently. (page 69)
Mode, Median, and Mean Summary • Mode: The mode of a data set is the value that occurs most frequently. (page 69)
Range Summary • Range is the difference between the largest and smallest values in a data set
Sample Standard Deviation • The variance is a measure of how far a set of numbers are spread out from each other
Sample Standard Deviation • The sample standard deviation gives you how the data is spread about the sample mean.
Sample Standard Deviation • The sample standard deviation gives you how the data is spread about the sample mean.
Empirical Rule • Empirical Rule for data with a bell-shaped distribution, the standard deviation has the following characteristics. • About 68% of the data lies within one standard deviation of the mean. • About 95% of the data lies within two standard deviations of the mean. 3. About 99.7% of the data lies within three standard deviations of the mean.