Download
1 / 92
920 likes | 1.37k Views
Road Safety Management for Pedestrians and Bicyclists. Offer Grembek Co-Director, UC Berkeley, SafeTREC. Presented at School of Transportation Engineering, Tongji University October 26, 2015. Research Collaborators. UC Berkeley Offer Grembek , PhD David Ragland, PhD, MPH

E N D
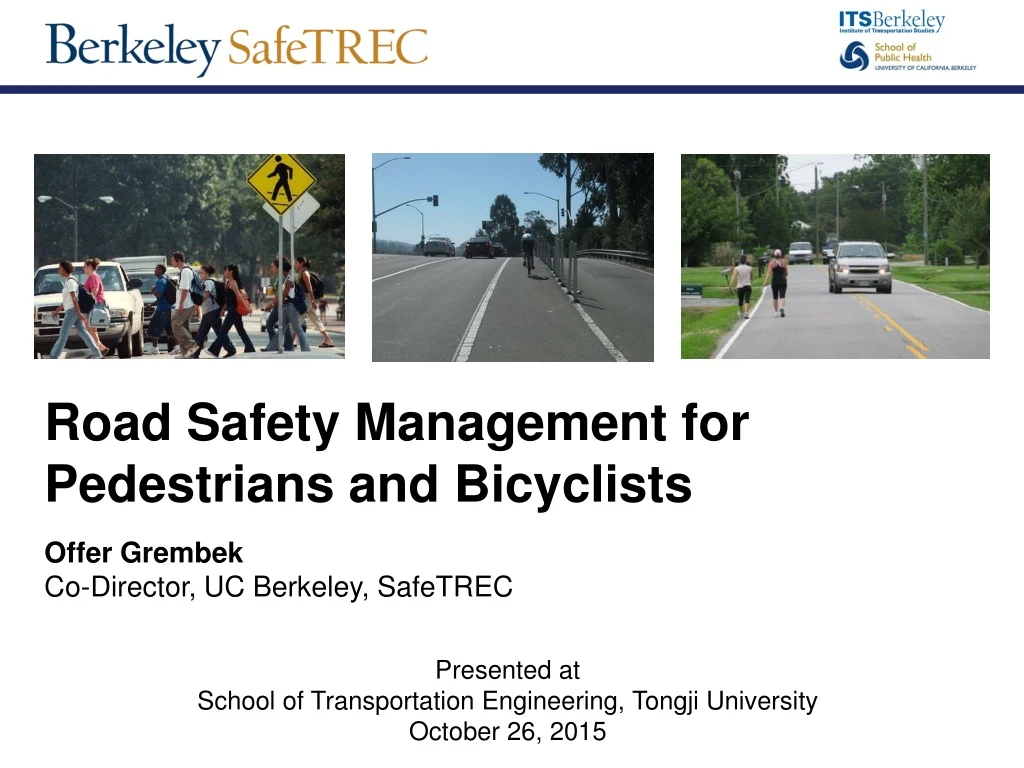
Road Safety Management for Pedestrians and Bicyclists Offer Grembek Co-Director, UC Berkeley, SafeTREC Presented at School of Transportation Engineering, Tongji University October 26, 2015
Research Collaborators UC Berkeley • Offer Grembek, PhD • David Ragland, PhD, MPH • Julia Griswold, PhD • AdityaMedury, PhD • Yuanyuan Zhang, PhD • Frank Proulx • Jessica Nguyen • SemichChousein University of Minnesota • Robert Schneider, PhD Tongji University • Junhua Wang, PhD • Ying Ni, PhD
The Traffic Safety Problem in CA Facts and Figures Over 34,000 traffic fatalities in the past 10 years. 2013 Figures 3,000 fatalities 33%↓ * Source: Fatality Analysis Reporting System (FARS), NHTSA * Source: Fatality Analysis Reporting System (FARS), NHTSA
The Traffic Safety Problem in CA Facts and Figures Over 34,000 traffic fatalities in the past 10 years. Since 2010 (end of recession) there is a 10% increase in fatalities 2013 Figures 3,000 fatalities 33%↓ 10%↑ * Source: Fatality Analysis Reporting System (FARS), NHTSA * Source: Fatality Analysis Reporting System (FARS), NHTSA
Passenger Vehicle Fatalities Facts and Figures Over 21,000 passenger vehicle fatalities in the past 10 years. 2013 Figures 1,611 fatalities 10%↑ * Source: Fatality Analysis Reporting System (FARS), NHTSA
Passenger Vehicle Fatalities Facts and Figures Over 21,000 passenger vehicle fatalities in the past 10 years. Since 2010 (end of recession) there is a 1% increase in passenger vehicle fatalities 2013 Figures 1,611 fatalities 10%↑ 1%↑ * Source: Fatality Analysis Reporting System (FARS), NHTSA
Pedestrian Fatalities Increased Facts and Figures Over 6,500 pedestrian fatalities in the past 10 years. 2013 Figures 701 fatalities 10%↑ 1%↑ * Source: Fatality Analysis Reporting System (FARS), NHTSA
Pedestrian Fatalities Increased Facts and Figures Over 6,500 pedestrian fatalities in the past 10 years. Since 2010 (end of recession) there is a 17%increase in pedestrian fatalities 2013 Figures 701 fatalities 10%↑ 1%↑ 17%↑ * Source: Fatality Analysis Reporting System (FARS), NHTSA
Bicycle Fatalities Increased Facts and Figures Over 1,100 pedestrian fatalities in the past 10 years. 2013 Figures 141 fatalities 10%↑ 1%↑ 17%↑ * Source: Fatality Analysis Reporting System (FARS), NHTSA
Bicycle Fatalities Increased Facts and Figures Over 1,100 pedestrian fatalities in the past 10 years. Since 2010 (end of recession) there is a 41%increase in bicycle fatalities 2013 Figures 141 fatalities 10%↑ 1%↑ 17%↑ 41%↑ * Source: Fatality Analysis Reporting System (FARS), NHTSA
P/B Fatalities are Increasing While passenger vehicles fatalities remained the same, pedestrian and bicycle fatalities have increased significantly over the past four years. 10%↑ 1%↑ 17%↑ 41%↑ * Source: Fatality Analysis Reporting System (FARS), NHTSA
The Vulnerability Matrix Table from Grembek (2010) * SWITRS 2005-2009, Injury crashes of two parties or less.
The Vulnerability Matrix Table from Grembek (2010) * SWITRS 2005-2009, Injury crashes of two parties or less.
The Vulnerability Matrix Table from Grembek (2010) * SWITRS 2005-2009, Injury crashes of two parties or less.
The Vulnerability Matrix Table from Grembek (2010) * SWITRS 2005-2009, Injury crashes of two parties or less.
The Vulnerability Matrix Table from Grembek (2010) * SWITRS 2005-2009, Injury crashes of two parties or less.
The Vulnerability Matrix Table from Grembek (2010) * SWITRS 2005-2009, Injury crashes of two parties or less.
The Vulnerability of Pedestrians Table from Grembek (2010) * SWITRS 2005-2009, Injury crashes of two parties or less. 40,202 1,088 = 36.95 – Relative vulnerability of pedestrians in the CA network In other words: pedestrians suffer 36.95 times more injuries than they inflict.
The Vulnerability of Bicyclists Table from Grembek (2010) * SWITRS 2005-2009, Injury crashes of two parties or less. 37,821 2,542 = 14.88 – Relative vulnerability of bicyclists in the CA network In other words: pedestrians suffer 14.88 times more injuries than they inflict.
P/B are the Most Vulnerable Tables from Grembek (2010)
Safety is Obtained by Buffers Passenger Vehicles Environment Industry Road User
Safety is Obtained by Buffers Passenger Vehicles Environment Industry Road User Pedestrians and Bikes Environment Road User Industry
Limited P/B Industry Safety Buffer Passenger Vehicles Environment Industry Road User Pedestrians and Bikes Environment Road User Industry
Elements and core facilities Sidewalk Buffer Approach Median Crosswalk Intersection Approach Buffer Sidewalk
Define an approach A1 N2 N1 A2
Pedestrian Crashes Absolute Number of Crashes
Pedestrian Crashes Absolute Number of Crashes
Pedestrian Crash Risk Crash Risk: (Crashes / Exposure)
Pedestrian Crash Risk Crash Risk: (Crashes / Counts)
Why model pedestrian exposure? 1000s of intersections in the SHS Data collection at all intersections is impractical Model can provide estimates for locations without counts
Pedestrian exposure can be modelled using regression Pedestrian Exposure = f(Environmental Characteristics)
Dependent Variable: pedestrian crossing counts Explanatory Variables: • Land Use: population, households, school, businesses • Transportation: street network, design, infrastructure • Other: vehicle ownership, slope
Site-level explanatory variables Number of Lanes Traffic signal AADT