Download
1 / 24
290 likes | 425 Views
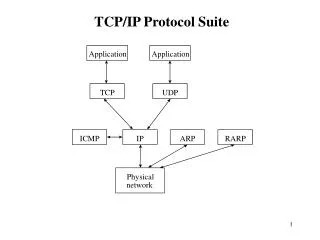
DRAINMOD APPLICATION. ABE 527 Computer Models in Environmental and Natural Resources. Review. drainage design … soil water characteristic… hourly rainfall, daily max & min temperature relative yield input data set.

E N D
DRAINMOD APPLICATION ABE 527 Computer Models in Environmental and Natural Resources
Review drainage design… soil water characteristic… hourly rainfall,daily max & min temperature relativeyield input data set Note: A DRAINMOD hydrology simulation can be run without specifying a relative yield input data set.
Objectives • After this lecture, you should get familiar with DRAINMOD application as for: • How to input your own data to DRAINMOD • required format; • What to consider for calibration purpose; and • How to use the model to predict subsurface • drain flow, water table depth, and crop yield. • for different drain spacings.
W20 W5 W10 E20 E5 E10 Southeast Purdue Agriculture Center Drainage Field (SEPAC) Monitoring: Subsurface drain flow Water quality samples
Model Inputs - Hourly rainfall - Daily maximum and minimum temperatures (measured on site or from nearby stations)
Model Inputs - Hourly rainfall - Daily maximum and minimum temperatures
Model Inputs - Drainage design parameters Note: parameter to be calibrated—Surface micro storage S1
Model Inputscont. - Soil properties: soil water characteristic, saturated hydraulic conductivity Note: parameters to be calibrated— lateral Ksat; volumetric moisture at 0 cm tension;and the vertical hydraulic conductivity of the restrictive layer
Model Inputscont. - Crop parameters Time distributions of effective rooting depths
Calibration Procedure 1. Choose most uncertain parameters to be calibrated Range of parameter needed to be calibrated
W20 W5 W10 E20 E5 E10 Calibration Procedure cont. 2. Choose plot and year to be calibrated --West block and east block need to be calibrated separately. --W20 and E20 in 1988-1989 were chosen.
Calibration Objective Functions (1) Nash-Sutcliffe efficiency: (2)Absolute percent error: Aggregated function, combining (1) and (2):
Automatic Calibration Parameter values against model Nash-Sutcliffe efficiencies
SUMMARY • Nash-Sutcliffe efficiency (EF) for daily drain flow ranging from -0.66 to 0.81; • EF for water table depth from -0.66 to 0.9; • Statistical tests of EF indicating insignificant difference among the three drain spacings; • Both observed and predicted relative yields indicating yields decreasing with the increase of drain spacing; • Average percent errors ranging from 1.3 to 9.7% for corn yield and from -0.8 to 10.3% for soybean yield.