Download
1 / 13
220 likes | 925 Views
Graphs of Piecewise Linear Functions. Define appropriate quantities from a situation, choose and interpret the scale and the origin for the graph, and graph the piecewise linear function. Learning Goal 2 (HS.N-Q.A.1, 2, 3):

E N D
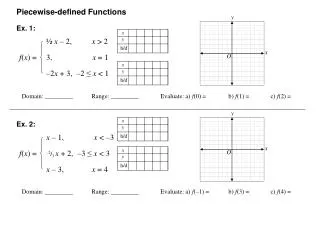
Graphs of Piecewise Linear Functions Define appropriate quantities from a situation, choose and interpret the scale and the origin for the graph, and graph the piecewise linear function.
Learning Goal 2 (HS.N-Q.A.1, 2, 3): The student will be able to use units to solve multi-step contextual problems.
Video • Watch the following video. • Your goal is to be able to describe the motion of the man in words. • Describe the motion of the man in the video. • Describe the man in terms of change in elevation of the man and the amount of time.
Video…Analyze • How high do you think the man was at the top of the stairs? • How did you estimate that elevation? • Were there intervals of time when his elevation wasn’t changing? • Was he still moving? • Did his elevation ever increased? • When?
Video…Graph • How should we label the vertical axis? • What measurement should we choose (feet or meters)? • How should we label the horizontal axis? • What unit of measure should we choose? • Should we measure the man’s elevation to his feet or to his head on the graph? • The man starts at the top of the stairs. Where would that be located on the graph? • Draw the graph.
What the graph could look like. Elevation vs. Time Graph Man in Green Jacket Elevation (feet) 2 4 6 8 10 12 14 16 Time (Seconds)
Elevation Vs. Time Graph #2 • With a partner describe what this person might have been doing.
What is happening in the story when the graph is increasing? • Decreasing? • Staying constant? • What does it mean for one part of the graph to be steeper than another part? • How doesslope of each line segment relate to the context of the person’s elevation?
Is it possible that this is a graph of a person moving up and down a vertical ladder? • Is it possible for someone walking on a hill to produce this graph? • What was the average rate of change of the person’s elevation between time 0 minutes and time 4 minutes? • 10/4 feet per minute or 2.5 feet per minute.
What type of equation (s) would be required to create this graph?
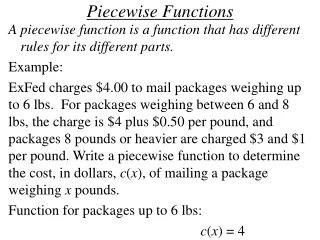
Piecewise Linear Function • Definition: Given non-overlapping intervals on the real number line, a (real) piecewise linear function is a function from the union of the intervals on the real number line that is defined by (possible different) linear functions on each interval. • All the graphs we studied today are Piecewise Linear Functions. • Here are a few more:
…union of intervals.. • Piecewise linear functions are defined over an interval of time shown on the horizontal axis. List those time intervals. • (0 to 2) • (2 to 5) • (5 to 7)