Download
1 / 44
440 likes | 460 Views
Explore the impact of climate change on sustainability and learn about positive responses and solutions. This conference presentation focuses on local, regional, Australian, and global drivers and symptoms of climate change.

E N D
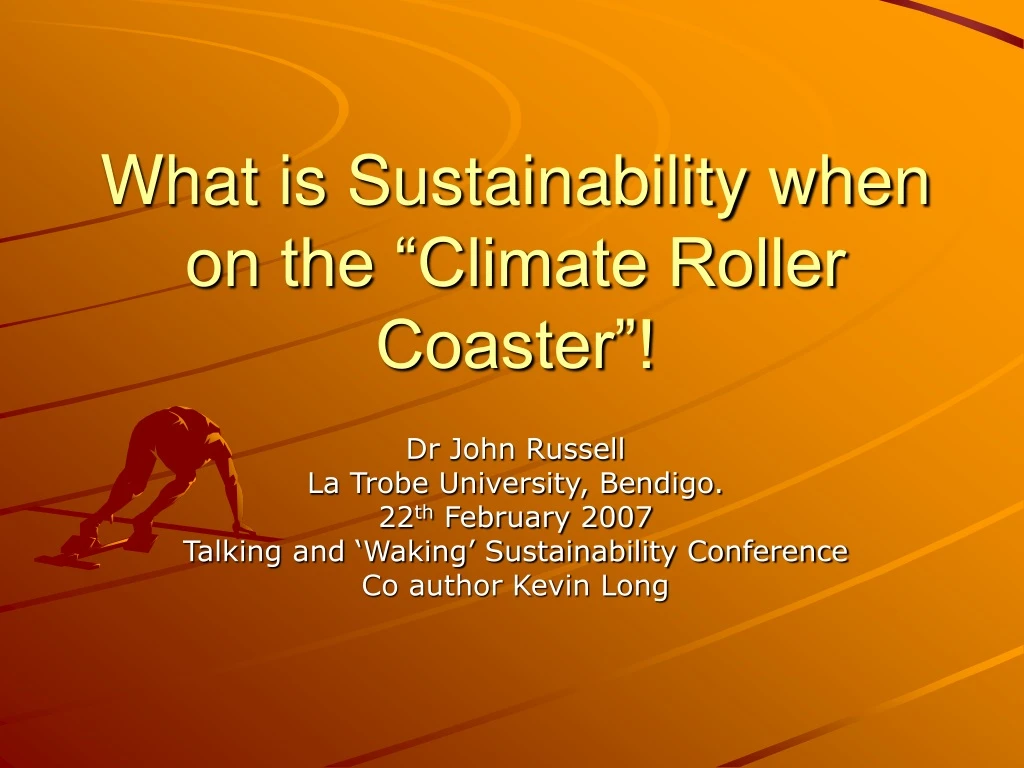
What is Sustainability when on the “Climate Roller Coaster”! Dr John Russell La Trobe University, Bendigo. 22th February 2007 Talking and ‘Waking’ Sustainability Conference Co author Kevin Long
OUTLINE • How Bad is it? • The “Climate Roller Coaster”! • What the papers say and positive responses
How Bad is it? • Local • Regional • Australian and New Zealand • Global Drivers/Symptoms – El Nino
Research Findings – Lake Eppalock Catchment – Location & Weather Figure 1 The Goulburn-Murray Water Region in North Central Victoria showing the Headworks and Extent of Irrigation. Map published by G-M Water
Research Findings • Weather Systems and Weathering Cycles • Wet and Dry Sequences in the Bendigo Region
Dry Sequence Dry Wet Sequence 1878 to1952 1952 to 1996 Decreasing annual inflow Campaspe River Inflow to Lake Eppalock
Comparison of Wet & Dry Sequences Table 1 - A Summary of the Relationship between the Average Yearly Rainfall at Metcalfe and Inflow into Lake Eppalock. Note: 1mm of effective runoff equates to approximately 1% of reservoir fill. (Goulburn-Murray Water, 2005)
Eppalock Inflows Actual v Expected Figure 4 Eppalock Inflow Actual May 2000 to October 2005 and Average Inflow Envelope for Wet Sequence 1954 – 1996 (Zero inflow for 2006 as at 8th October 2006)
Figure 5. Shows the Combined Seasonal Inflow and Drawdown on Lake Eppalock from July 1996 to July 2006: In Hindsight a Gambol that did not Payoff.
Australian Rainfall Anomalies Figure 6 Australian Rainfall Anomalies – 36 months. Departures from the 36 month mean (1961 – 1990 base period)
Trend of Annual Rainfall Loss at Bendigo Table 1 Trend of Annual Rainfall Loss at Bendigo
First Prime Minister’s Briefing Figure 7 Showing the Total Average inflows into the MDB - Comparing Drought Periods. Current inflow for 2006 shown in red.
First Prime Minister’s Briefing 7th November 2006 Figures 8a and 8b. Showing the River Murray Inflows and Diversions for an extreme dry outlook.
First Prime Minister’s Briefing 7th November 2006 Figures 8a and 8b. Showing the River Murray Inflows and Diversions for an extreme dry outlook.
Research Findings- Global Weather Uncertainities Major Factors • The level of net radiation flux reaching the earth from the sun • global dimming due to air-travel • global pollution of particulates smaller than 2.5 micron • global warming gases due to human activity and • The rapid changing of carbon sinks. I.e. loss of forests, reduction of soil carbon etc.
Research Findings- Global Weather Uncertainties Major Symptoms • A weakening of trade winds • melting of glaciers, permafrost, Arctic and Antarctic ice • slowing of the Gulf-stream • extremes in droughts, fires, floods • acidification of the oceans and • The maintenance of abnormally warm South China and Philippines Seas.
Pacific Ocean Recent Trends – El Nino Event La Nina Event Figure 9 Comparison of Classical El Nino and La Nina Events
Pacific Ocean Recent Trends – El Nino La Nina Figure 10 Classic paths of Cyclones resultant from either El Nino or La Nina Events
Top 10 El Nino Events Figure 11 Top 10 El Nino Events of the Twentieth Century incorporating Global Surface Mean Temperature Anomalies
Trends of Annual Rainfall 1970 - 2005 Figure 13 Trend of Annual Rainfall1970 - 2005 (mm/10years)
“Climate Roller Coaster” 500,000 Years Figure 17 Showing the Cyclical Traces of Carbon Dioxide, Methane and Infra Red Temperature for the past 420000 years taken from the Vostok Ice Core where the Glacial-interglacial Cycling was measured. Note: Maximum CO2 reading is approximately 300ppmv current reading is approximately 360ppmv.
“Climate Roller Coaster” 100,000 years Figure 17 Showing the Cyclical Traces of Carbon Dioxide, Methane and Infra Red Temperature for the past 420000 years taken from the Vostok Ice Core where the Glacial-interglacial Cycling was measured. Note: Maximum CO2 reading is approximately 300ppmv current reading is approximately 360ppmv.
“Climate Roller Coaster” 1000 years Figure 19 1000 years of Northern Hemisphere Temperatures in a Degrees Centigrade.
What follows, • Our Time Frames • What the ‘papers’ say, • Advantages of Biological Farming in times of soil moisture stress • Carbon Credits – Soil Sequestration Potential for our regional industries • Bio-Diesel power our region! • Applicability of ‘Fodder Factories” for our region industries
Advantages of biological farming in times of soil-moisture stress
Carbon Credits – Soil Sequestration Potential for our regional industries
Applicability of ‘Fodder Factories” for our region industries • 1 tonne fodder factory/day equivalent to 40 acres of irrigated permanent pasture. • 5 kg fodder per cow … 25% daily intake. • Water efficiency ratio 100 : 1 • 100 kg barley produces 1000 kg fodder grass. • Indoor Fodder factory Capital cost 2 tonnes/day - $85000 upwards • Outdoor Fodder factory Capital cost 2 tonnes/day - $20000