Download
1 / 8
80 likes | 188 Views
Negative depletion. FACS purified. Supplementary Figure 1 - transcripts regulated in tolerance, purification method discernible by colour. a) upregulated transcripts, data as for manuscript figure 1a. 1000. 10000. 100. 1000. 10. 100. gfi-1. lck. TGIF. Egr-1. Egr-2. CD72. CD83.

E N D
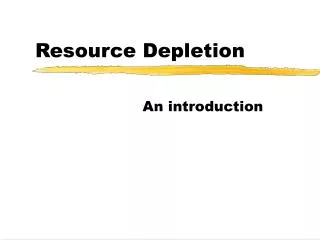
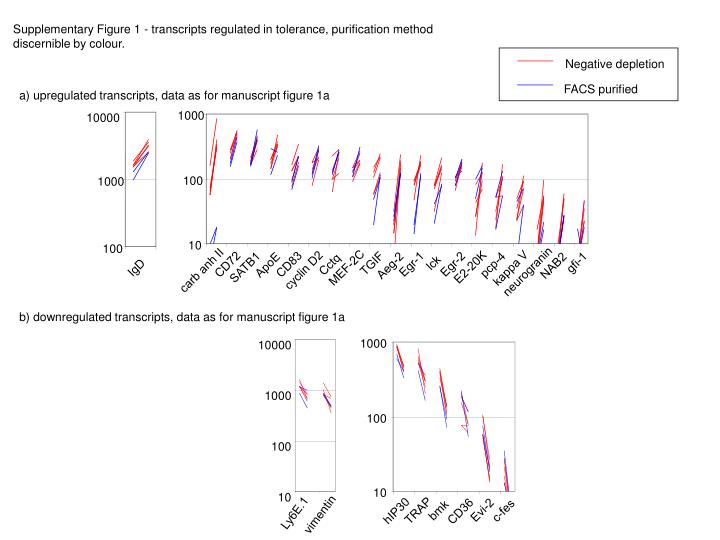
Negative depletion FACS purified Supplementary Figure 1 - transcripts regulated in tolerance, purification method discernible by colour. a) upregulated transcripts, data as for manuscript figure 1a 1000 10000 100 1000 10 100 gfi-1 lck TGIF Egr-1 Egr-2 CD72 CD83 Cctq pcp-4 ApoE Aeg-2 NAB2 SATB1 E2-20K IgD MEF-2C kappa V cyclin D2 carb anh II neurogranin b) downregulated transcripts, data as for manuscript figure 1a 1000 10000 1000 100 100 10 10 Evi-2 bmk c-fes TRAP hIP30 CD36 Ly6E.1 vimentin
Negative depletion FACS purified c) contaminating myeloid transcripts depleted by FACS purification 10000 1000 100 10 1 2ndary granule MRP14 lipocalin 2 MRP8 d) contaminating erythroid transcripts depleted by FACS purification 1000 100 10 BPGM amino ferrochelatase levulinate band 3 carb anh II snthse
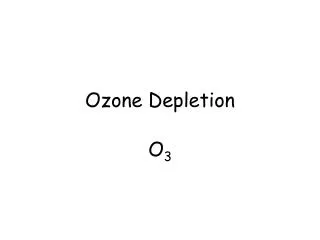
IgHEL cells +/- HEL Supplementary Figure 2a - upregulated transcripts after 1 hour activation, responses of IgHEL and B6 cells discernible by colour. Data as for manuscript figure 2a B6 cells +/- anti-mu 10000 1000 100 10 1 gfi-1 EZF AhR c-fos Egr-1 Egr-2 mafK TIS11 Nur77 LSIRF NAB2 Fos B Stra13 c-myc TIS11b LRG-21 gadd153 C/EBP beta 10000 1000 100 10 1 CD72 RP105 PEP TIS7 uPAR MIP-1 a EBI2 MKP1 MIP-1 b MyD116 Evi-2 4F2 kir/gem SNK IL1-R2 A1 hRab30 PAC-1 BL34 BL34 MacMARCKS
1 Id3 Supplementary Figure 2b - downregulated transcripts after 1 hour activation. Data as for manuscript figure 2b IgHEL cells +/- HEL B6 cells +/- anti-mu 10000 1000 100 10 B29 G7e EFP NAG bcl-3 scd2 Stat1 LKLF hRhoH iap38 SLAP BKLF GILZ GILZ TRAF5 IFNg-RII hIFI-204 LT-beta gadd45 mCDC47 Caspase2 Kappa 0 ig
Supplementary Figure 3a - upregulated transcripts after 1 hour activation in presence of FK506. Data presented as for manuscript figure 3a IgHEL cells +/- HEL B6 cells +/- anti-mu 10000 1000 100 10 1 4F2 TIS7 EZF gfi-1 SNK c-fos Egr-1 mafK Nur77 TIS11 BL34 BL34 uPAR NAB2 Fos B Stra13 RP105 PAC-1 LRG-21 gadd153 C/EBP beta 10000 1000 100 10 1 A1 AhR EBI2 PEP Evi-2 Egr-2 c-myc LSIRF IL1-R2 MKP1 TIS11b kir/gem MIP-1 b MIP-1 a hRab30 MyD116 MacMARCKS
Supplementary Figure 3b - downregulated transcripts after 1 hour activation in presence of FK506. Data presented as for manuscript figure 3b IgHEL cells +/- HEL B6 cells +/- anti-mu 10000 1000 100 10 1 Id3 B29 GILZ GILZ G7e EFP NAG bcl-3 scd2 Stat1 LKLF iap38 SLAP BKLF hRhoH TRAF5 IFNg-RII hIFI-204 LT-beta gadd45 CDC47 caspase 2 kappa 0 ig
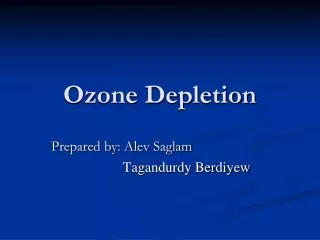
3000 2500 2000 1500 1000 500 0 GILZ SLAP LKLF LT-beta Stat1 iap38 kappa hIFI- GILZ BKLF EFP Id3 Supplementary Figure 4a - 1 hour response genes that were affected by in vitro incubation Genes upregulated by antigen, 1 hour 2500 - incubation 2000 + incubation 1500 hybridisation intensity 1000 Data shown are for 1 hr response genes that showed a significant effect of incubation. Blue bars represent IgHEL samples directly lysed after purification, purple bars show IgHEL cells that were mock stimulated by incubation on tissue culture plastic for 1 hour. Error bars are 1 standard deviation. Genes not shown were not affected by in vitro incubation. 500 0 EBI2 4F2 EZF TIS7 Evi-2 MKP1 TIS11 gfi-1 uPAR Ah-R c-fos Fos B RP105 TIS11b IL1-R2 Nur77 MIP-1 a Stra13 MyD116 gadd153 MacMARCKS downregulated by incubation upregulated by incubation Genes downregulated by antigen, 1 hour hybridisation intensity 0 ig 204 downregulated by incubation upregulated by incubation
Supplementary Figure 4b - 1 and 6 hour response genes that were affected by in vitro incubation Unchanged by incubation Increased by incubation Downregulated by antigen at 1 hr Upregulated by antigen at 1 hr Decreased by incubation 1000 10000 1000 In vitro incubation does not resemble a partial activation response as many transcripts are regulated in different directions by antigen and in vitro incubation 100 incubation incubation 100 10 10 1 1 1 10 100 1000 10000 1 10 100 1000 10000 No incubation No incubation Downregulated by antigen at 6 hr Upregulated by antigen at 6 hr 10000 10000 1000 1000 100 incubation 100 incubation 10 10 1 1 1 10 100 1000 10000 1 10 100 1000 10000 No incubation No incubation