Download
1 / 17
180 likes | 417 Views
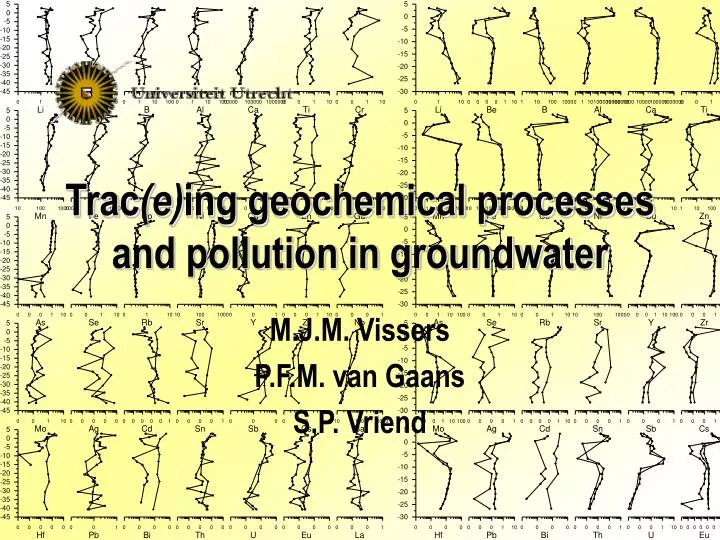
Trac (e) ing geochemical processes and pollution in groundwater. M.J.M. Vissers P.F.M. van Gaans S.P. Vriend. Multilevel wells have advantages over single level GWQ networks when studying trace elements. Many geochemical processes + The dynamic behavior of groundwater +

E N D
Trac(e)ing geochemical processes and pollution in groundwater M.J.M. Vissers P.F.M. van Gaans S.P. Vriend
Multilevel wells have advantages over single level GWQ networks when studying trace elements • Many geochemical processes + • The dynamic behavior of groundwater + • Changes in input (anthropogenic influence) i.e. no steady state + • (Analytical / sampling errors )
I will show this by presenting: Study area and processes that (may) occur Two example elements • Rubidium • Uranium
Sandy, unconsolidated aquifer, with ice-pushed ridge in the east Mainly Agricultural land use, eastern part cultivated in the 1920’s 10 Borings, total of 244 mini screens Study area and processesMap of the study area
A5 A10 Clay Clay 2 km Boring with mini well screens Calcite saturated waters NO3/Fe redox boundary SO4 redox boundary Groundwater level Streamlines Pine / deciduous forest Arable land (mostly corn) Study area and processesCross-section of the study area • Filtrated over 0.45μm, analyzed on ICP-MS • Sampled in 1989 (no trace elements), 1996 (½), and 2002 (all) • Randomly analyzed on > 70 inorganic components and DOC
> 60 11 9 4 5 Pollution / changes in input Iron reduction Mn reduction Sulphate reduction pH changes / carbonate buffering Mineral Dissolution / Precipitation Coprecipitation / Codissolution Adsorption / Desorption Kinetics Analytical problems Study area and processesProcesses and number of observed boundaries In major elements
Rubidium and Uranium Two example elements • Rubidium: “No” mineral phases, input from either recharge or sediment, and adsorption processes are expected to play role • Uranium: Many saturation phases, depending on redox conditions. What is needed for interpretation? • Concentration – depth profiles of trace element • Knowledge derived from macro-chemistry • Geochemical knowledge
“Noisy profiles” Base level RubidiumConcentration (μg/l) - depth profiles of all borings
“Ox” Red Acid Buff RubidiumInput and adsorption, and influence of pH and redox in boring A7 • Rubidium 0.3 μg/l in pristene water • Adsorption plays a role (retention): boring A5 and A8 • Input by recharge (up to 100 μg/l) • No (direct) influence of redox and pH boundaries
UraniumSI – Eh dependence of a 6 ppb groundwater Log Saturation index Eh (mv)
Low concentrations as complete boring is reduced: Uraninite UraniumConcentration (μg/l) – depth profiles of all borings U (µg/l)
Oxic waters: Undersaturation, concentrations determined by recharge Uranium U (µg/l)
High concentrations, not related to input Uranium U (µg/l)
UraniumConcentration – depth profiles of boring A7 in μg/l μ
Uranium • Iron reduced waters have concentrations of 0.001 – 0.05 μg/l (uraninite saturation) • Input in recently recharged water: 0.1μg/l • In deeper oxic water lower concentrations are found • At reduction boundary (manganese reduced) concentrations reach 1 – 8 μg/l • Source is the sediment
Conclusions In the examples, multilevel wells give possibility to: • Determine background concentration for Rb • Exclude redox and pH as important process for Rb • Show input and retention are important for Rb • Accuratly determine redox zone of high U • Exclude pollution as potential U-source • Estimate input of U from recharge and from sediment m.vissers@geog.uu.nl
Conclusions II • Even with the help of multilevel wells, it is hard to determine trace element systematics m.vissers@geog.uu.nl