Download
1 / 16
160 likes | 257 Views
Sampling Techniques for Large, Dynamic Graphs. Daniel Stutzbach – University of Oregon Reza Rejaie – University of Oregon Nick Duffield – AT&T Labs—Research Subhabrata Sen – AT&T Labs—Research Walter Willinger – AT&T Labs—Research. Global Internet Symposium Barcelona, Spain

E N D
Sampling Techniques for Large, Dynamic Graphs Daniel Stutzbach – University of Oregon Reza Rejaie – University of Oregon Nick Duffield – AT&T Labs—Research Subhabrata Sen – AT&T Labs—Research Walter Willinger – AT&T Labs—Research Global Internet Symposium Barcelona, Spain April 28th, 2006
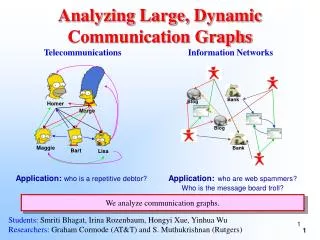
Motivation • P2P systems are very popular in practice. • Several million simultaneous users collectively. • 60% of all Internet traffic [CacheLogic Research 2005] • Measurement studies aid understanding existing systems and user behavior. • Capturing global state is often infeasible. • P2P systems are large and rapidly changing. • Sampling is therefore a natural approach, and has been used in several earlier measurement studies. • But how do we know the samples are representative?
The Problem • We focus on sampling peer properties. • Peer degree • Link Bandwidth • Number of shared files • Remaining uptime • Sampling peer properties occurs in two steps: • Discover and select peers • Collect the measurements • Selecting peers uniformly at random is hard. • Peer dynamics can introduce bias. • The graph topology can introduce bias. • We examine these two problems separately.
Temporal Causes of Bias • Define Vt as the set of peers present at time t. • We gather samples over a measurement window of length Δ. • The most common approach is to gather peers from the set present during the window:
Example of Bias towards Short-Lived Peers Time Long-lived peer Short-lived peers • Consider a simple two-peer system, containing: • One long-lived peer • One rapidly-changing short-lived peer • The common approach over-selects short-lived peers. • XXX I plan to update this slide with animation to show how a particular measurement window selects too many short-lived peers
Handling Temporal Causes of Bias • The common approach is intuitive but incorrect. • Sampling peers is the wrong goal. • We want to sample peer properties. • Therefore, vi,t and vi,t’ are distinct, even though they come from the same peer. • Allow sampling the same peer more than once, at different points in time.
Example of avoiding bias towards Short-Lived Peers Time Long-lived peer Short-lived peers • Allowing re-selecting a peer solves the problem. • The long-lived peer will be selected half the time, reflecting the actual state of the system. • Now the problem remains, how do we select a peer uniformly a random at a particular moment? • XXX I plan to update this slide with animation
Topological Causes of Bias • Goal: Select a peer uniformly at time t • Begin with one peer. • Query peers to discover neighbors. • Prior work uses classic graph-discovery algorithms: • Breadth-First Search (BFS) • Depth-First Search (DFS) • Problems with these techniques: • Peers are correlated by their neighbor relationship • Peers with higher degree are more likely to be discovered. • A peer can only be selected once. • Random walks are a promising alternative. XXX Some kind of animation here showing the discovery process (using breadth-first search)
Random Walks • Basic idea of the random walk: • Select a neighbor randomly to explore • Explore that neighbor and “forget” the previous peer • Only two pieces of state are maintained: • The current peer • The length of the walk • A subset of visited peers are selected for sampling • The basic random walk selects a peer every r steps. • Graph theory suggests r≥ log(|V|). • Walking r steps between samples eliminates correlations. • Peers are selected with probability proportional to degree. • Peers can be selected more than once.
Variations on the Random Walk • Fixing the degree bias (“Degree Correction”) • Select a candidate peer with probability • Pro: Should result in uniform selection of peers • Con: Decreases efficiency • Improving efficiency (“Random Stroll”) • After the first r steps, select every peer instead of every r peers • Pro: Increases efficiency • Con: Introduces slight correlations
Evaluations • We simulated different techniques over two types of graphs: • A snapshot of the Gnutella ultrapeer topology [Stutzbach 05 IMC] • Random graphs (with the same number of vertices and edges as the Gnutella topology) • Metrics: • Bias: Is peer A more likely to be selected than peer B? • Correlation: If we select peer A, are we more likely to select peer B? • Efficiency: How easily can we collect a sample? • Techniques: • Oracle (uniformly random) • Breadth-First Search (BFS) • Random Walk (RW) • Random Walk with Degree Correction (RWDC) • Random Stroll (RS) • Random Stroll with Degree Correction (RSDC)
Bias • Collect k|V| samples and compare with Oracle. • Most peers should be selected around k times. • RSDC appears unbiased in both cases. • RWDC performs well, but exhibits slight bias on Gnutella. • BFS, RS, and RW are heavily biased. Figures 1(a) and 1(b) go here
Correlation • Even if unbiased, a technique may exhibit correlations. • We define a sampling session as 1,000 consecutive samples. • For pair (A, B), if A is selected, how often is B also selected? • A long tail indicates correlation. • RWDC and RSDC appear uncorrelated. • RW and RS exhibit slight correlations. • BFS exhibits strong correlation. Figures 2(a) and 2(b) go here
Efficiency • The basic operation is the neighbors-query. • Efficiency is: • BFS and RS are close to 100% efficient. • Unfortunately, they are also heavily biased. • RW, RWDC, and RSDC are 2% to 8% efficient. • RSDC is twice as efficient as RWDC (4% vs. 2%). • However, even the inefficient techniques are O(log |V|).
Summary of Results and Lessons Learned • Addressing temporal causes of bias • Avoid gathering a set of peers and collecting measurements in separate passes. • Select a peer, then collect the measurement. • Repeat and allow re-selecting the same peer. • Addressing topological causes of bias • Be careful to avoid bias towards high-degree. • Consider using a random walk or random stroll with degree correction.
Ongoing Work • This work is preliminary. • Additional types of random walks: • Weighting the selection of the next hop • Additional types of graphs: • Power-law • Small world • We have examined temporal and topological causes of bias separately. • To examine them concurrently, we are creating a dynamic overlay simulator. • XXX This slide feels too much like a laundry list