Download

1 / 20
200 likes | 371 Views
Variation in Population Size. 1.3. Starter. Recap: Definitions of: Population? Abiotic ? Biotic?. Learning Objectives. State what factors determine the size of a population Describe the abiotic factors that affect the size of a population

E N D
Starter • Recap: • Definitions of: • Population? • Abiotic? • Biotic?
Learning Objectives • State what factors determine the size of a population • Describe the abiotic factors that affect the size of a population • Explain how these factors influence population size • Carry out Chi squared tests
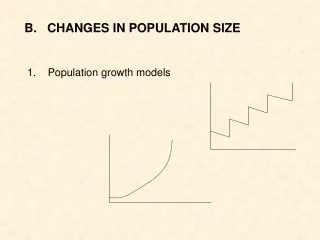
Population Growth Curves • Usually there are 3 phases: • Slow growth as numbers are built up • Rapid growth • Population growth decreases, population is approximately stable. Some variation due to...? Stable, no growth Rapid growth Slow growth
Population Size • Affected by limiting factors • Rapid growth can happen when there are no or few limiting factors e.g. Plants can grow rapidly if sunlight is not limiting • Once more organisms grow and reproduce, nutrients and other factors become limiting, slowing down overall increase in population size • The ultimate population size will be affected by biotic and abiotic factors.
Abiotic Factors • For the following abiotic factors write an explanation about how they would influence the size of a population • Temperature • Light • pH • Water and Humidity
Temperature • Population size will be smaller if the temperature is too far away from the optimum for that species • Enzymes • Too cold: enzymes slow down, metabolic rate decreases so growth is slower • Too hot: enzymes are denatured so population growth is slower • Warm-blooded animals: if the temperature is too far from the optimum a lot of energy is expended trying to maintain normal body temperature, so population growth slows.
Light • Photosynthesis rates will increase when light intensity increases, this means faster plant growth. • This will have an effect up the food chain, potentially increasing animal population size.
pH • Enzyme activity is affected by pH • Enzymes have an optimum pH at which they will work best • Population sizes will be larger when the conditions are the best pH for enzyme activity
Water and Humidity • Population sizes are often very small if there is little water present (only species such as xerophytes will be able to survive) • Changes in humidity will affect the transpiration rates of plants, thus affecting plant growth. • If the air is dry, only species adapted to this will be present in larger numbers.
Averages • Mean = sum of all values/number of values • Mode = most common value • Median = middle value when all values written out in order • Ecology field study, calculate the mean, median and mode for the data:
Chi Squared (X2) • The Chi-squared test is used to test a null hypothesis. • It allows us to compare our observed results with the expected results and decide whether or not there is a significant difference between them.
When do you use chi squared? It is a simple test that can only be used if certain criteria are met: • The sample size must be relatively large • The data must fall into discrete categories • Only raw counts and not percentages can be used
Chi-squared (X2) test Chi = sum of [observed numbers (O) – expected numbers (E)]2 Squared expected numbers (E) X 2 = (O – E)2 E S
Chi-squared test • The number obtained is then read off a chi-squared distribution table to determine whether any deviation from the expected results is significant or not. • Degrees of freedom – number of categories minus one (n-1).
Chi-squared • In the chi-squared test, the critical value is p = 0.05 (5%) • If the probability that the deviation is due to chance is more than p = 0.05 (i.e. a probability of more than 5%), we can reject the null hypothesis that there is no statistically significant difference between the observed and the expected results. • E.g. If your X2 value is 54.6 and the significance level at the appropriate degrees of freedom is 9.48 then you would reject the null hypothesis.
Question Null Hypothesis: there is no difference between the frequencies of animals over the 5 types of seaweed Expected Frequency = 100/5 = 20
Question S X 2 = (O – E)2 E
Question • Our X2 value is 79.9 • You then look this up in a Critical Value table, using your degrees of freedom (number of categories – 1, so it is 5 – 1 = 4) • The critical value at 5% is 9.48, our value is bigger than this, so we reject the null hypothesis
Application Questions • Complete application questions from page 12 of the A2 book