Download
1 / 14
160 likes | 337 Views
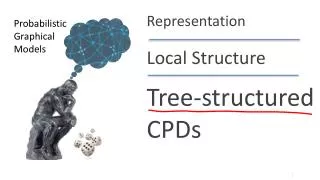
Representation. Probabilistic Graphical Models. Local Structure. Context-Specific CPDs. Tree CPD. A. a 0. a 1. S. (0.8,0.2). s 0. s 1. Apply. L. (0.1,0.9). l 0. l 1. Letter. SAT. (0.9,0.1). (0.4,0.6). Job.

E N D
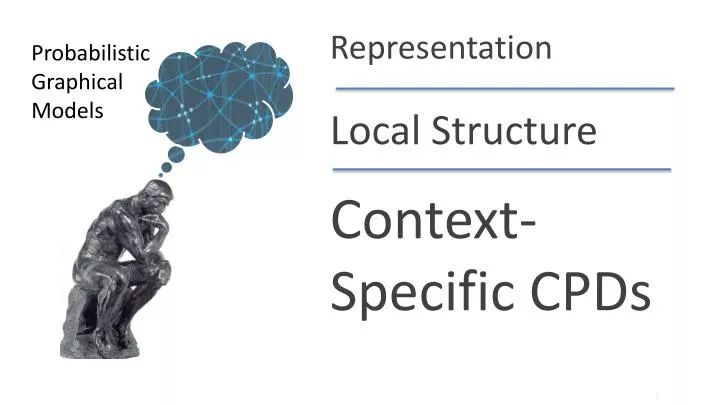
Representation Probabilistic Graphical Models Local Structure Context-Specific CPDs
Tree CPD A a0 a1 S (0.8,0.2) s0 s1 Apply L (0.1,0.9) l0 l1 Letter SAT (0.9,0.1) (0.4,0.6) Job
Which context-specific independencies are implied by the structure of this CPD? (Mark all that apply.) A a0 a1 S (0.8,0.2) s0 s1 L (0.1,0.9) l0 l1 (0.9,0.1) (0.4,0.6)
Tree CPD C c1 c2 L2 L1 l0 l0 l1 l1 Choice (0.8,0.2) (0.9,0.1) (0.1,0.9) (0.3,0.7) Letter1 Letter2 Job
Which non-context-specific independency is implied by the structure of this CPD? C c1 c2 L L l0 l0 l1 l1 (0.9,0.1) (0.8,0.2) (0.1,0.9) (0.3,0.7) Choice Letter1 Letter2 Job
C c1 c2 L L l0 l0 l1 l1 (0.8,0.2) (0.9,0.1) (0.1,0.9) (0.3,0.7) Choice Letter1 Letter2 Job
Multiplexer CPD . . . Z1 Z2 Zk A Y
Microsoft Troubleshooters # of parameters: 145 to 55
Suppose q is at a local minimum of a function. What will one iteration of gradient descent do? Leave q unchanged. Change q in a random direction. Move q towards the global minimum of J(q). Decrease q.
Consider the weight update: Which of these is a correct vectorized implementation?
Fig. A corresponds to a=0.01, Fig. B to a=0.1, Fig. C to a=1. Fig. A corresponds to a=0.1, Fig. B to a=0.01, Fig. C to a=1. Fig. A corresponds to a=1, Fig. B to a=0.01, Fig. C to a=0.1. Fig. A corresponds to a=1, Fig. B to a=0.1, Fig. C to a=0.01.