Download
1 / 8
80 likes | 224 Views
Efficiencies in Murrumbidgee Irrigation Area GL 2000/01. Total water supply 1630. Shallow ground- water. Irrigation water (surface ). 118. Current. 1048. 1419 ET. 87%. Water use efficiency. 91%. Off-farm conveyance. 90%. 95%. 946. Edge of farm. 1,300,241 tonnes.

E N D
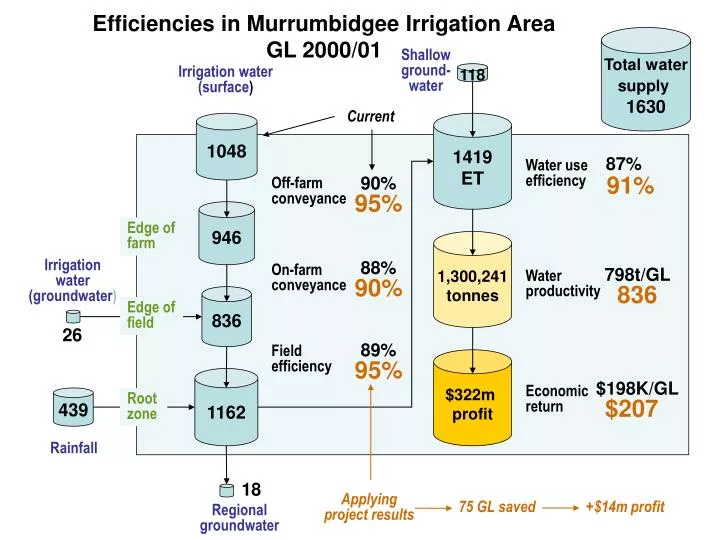
Efficiencies in Murrumbidgee Irrigation AreaGL 2000/01 Total watersupply1630 Shallow ground-water Irrigation water (surface) 118 Current 1048 1419ET 87% Water use efficiency 91% Off-farm conveyance 90% 95% 946 Edge of farm 1,300,241tonnes Irrigation water (groundwater) 88% On-farm conveyance 798t/GL Water productivity 90% 836 836 Edge offield 26 89% Field efficiency $322m profit 95% 1162 $198K/GL Economic return 439 Root zone $207 Rainfall 18 Applying project results 75 GL saved +$14m profit Regional groundwater
Improving efficiency Off-farm
Early application of our water systems economics Cost-benefit of options commissioned on behalf of the Kimberley Expert Panel: Establishing the baseline price of water under future supply and demand scenarios
Evaluating progress toward the Goal TERM Water in the Australian Economy By 2032: 5 Million more people 34% increase in irrigation efficiency 22% increase in household efficiency 15% decrease in rainfall ± water recycling ± seawater desalination ± rural water trading Perth $10.50 $5.80 Shadow price $kL $4.20 $3.80 2032 2001
Impacts valued to date • Some of the research impacts that the Flagship has valued: • Identified an additional 20 Gigalitres per annum of recoverable water from Perth primary groundwater supply (saving about $200m in capital works); • Climate analyses underpinning accelerated investments in new water infrastructure in WA and Vic of $500M and $50M. • Identified irrigation water savings of about 295 GL in the Murrumbidgee catchment (worth about $200m on the permanent trade market).
What we will look like in 2007-2008 • $80M annual R$D budget ($30M external) • Four Themes • Water Resource Observation Network • Better Basin Futures • Urban Water • Healthy Water Ecosystems • Regional portfolios: • SEQ • WA • MDB • Northern Australia • Research and adoption - in excess of 50 partners across Australia.