Download
1 / 33
330 likes | 595 Views
RESERVE DESIGN. Review Case Studies in Reserve Design Cape Floristic Region, South Africa Marine Protected Areas, Bohol Island, Phillipines. RESERVE DESIGN. The Goal: A reserve system that includes and sustains all biodiversity and ecosystem processes of the region.

E N D
RESERVE DESIGN Review Case Studies in Reserve Design Cape Floristic Region, South Africa Marine Protected Areas, Bohol Island, Phillipines
RESERVE DESIGN The Goal: A reserve system that includes and sustains all biodiversity and ecosystem processes of the region We don’t have time to count everything so How do we assess “all” biodiversity quickly
What can we use as surrogates for overall biodiversity? Flagship Species No –charismatic but don’t capture other species Umbrella Species No Biodiversity Indicators – birds(lots info); dung beetles(easy to collect info) No – hotspots for one taxa≠hotspots for others\ Land types - land systems or vegetation classes
What can we use as surrogates for overall biodiversity? Flagship Species No –charismatic but don’t capture other species Umbrella Species No Biodiversity Indicators – birds(lots info); dung beetles(easy to collect info) No – hotspots for one taxa≠hotspots for others\ Land types - land systems or vegetation classes eg 1 South Africa - YES
Evaluating use of landtypes in reserve design Cape Floristic Region, SA 122,000 km2 - > 6000 endemic plant species UNESCO World heritage site
Evaluating use of landtypes in reserve design Cape Floristic Region, SA 122,000 km2 102 broad habitat units (untransformed land) vegetation climate geology topography Reserve selection - current reserve selected + minimum set to achieve conservation target (%) by BHU
Evaluating use of landtypes in reserve design Cape Floristic Region, SA How representative are the reserves? Plants - proteas Vertebrates - fish, amphibians, reptiles BHU minimum set represented 79% of unreserved proteas 35% of unreserved vertebrates BHUs are a good surrogate for SOME Species
Summary Surrogates for overall biodiversity? Flagships NO Biodiversity Indicators NO Landtypes not always So what features should be used? Combine inexpensive land type info with other surrogates
CASE STUDY 1 Cape Floristic Region, SA UNESCO World heritage site Smallest of world’s floristic regions Highest density of plant species in the world Biodiversity Hotspot
Cape Floristic Region, SA Fynbos - “fine bush” Fire-prone shrub 80% of area >7000 plant spp
Cape Floristic Region, SA Renosterveld - “rhinoceros scrub” lowlands Shrub + Coastal dunes dominated by members of daisy family
Cape Floristic Region, SA Reptiles 100 spp. 10 endemics bontebok Mammals 90 spp 4 endemics
Cape Floristic Region, SA Birds 324 spp., 6 endemics Endemic Bird Area (IBA) - Birdlife International Amphibians 51 spp. 16 endemics
STATUS of BIODIVERSITY IUCN RED LIST FLORA - 1406 Endangered - 300 Critically endangered - 29 Extinct in wild FAUNA - Threatened=CR, EN or VU - 21 mammals, 12 birds - 15 fish, 5 reptiles, 5 amphibians - 6 butterflies, 6 dragonflies
THREATS to BIODIVERSITY Habitat loss - lowland fynbos 83% of original - lowland renosterveld 48% original - matrix = agriculture/urban development - remnants fragmented/isolated/degraded Invasive species - upland/lowland fynbos - 70% invaded by - fire adapted tree spp. 33% CFR transformed 20% pristine
CAPE ACTION PLAN for the ENVIRONMENT Initiated 1998 Govt, academia, NGOs, local community AIM Identify and establish a representative reserve system Ensure sustainable yields from biodiversity resources Improve conservation policies and legislation and strengthen capacity to implement them
SYSTEMATIC CONSERVATION PLANNING Stage 2: Conservation goals Identify elements to protect Land classes 102 BHUs Proteacae locality records for 364 spp. Selected lower vertebrates 345 spp. Large and medium sized mammals 41 spp. Ecological and evolutionary processes Target varies with heterogeneity, vulnerability, original extent 10-100% Varies with threat 1-15 records Varies with threat 1-2 records Varies with endemism, range 10-2000 individuals 1-15 records
Stage 2: Conservation goals ctd Ecological and evolutionary processes Diversification across edaphic interfaces ----> 1 km wide interface between soil types Diversification across upland/lowland interface Faunal seasonal migration Response to climate change ----> 1 km wide paths across gradients eg coastal lowland --> interior mountain Migration and diversification between inland and coastal biotas ---> whole inter-basin riverine corridors 500m wide, all untransformed lengths + restorable sections
Stage 3: Review existing conservation areas GIS based GAP analysis 22% of CFR has some level of protection 189 sites 49% secure statutary conservation areas 51% less secure (state/municipal/private) BUT Unrepresentative 50% Mountain Fynbos Complex (>target) 9% Lowland BHUs Spatial components of ecological process not captured
Stage 4. Selection of additional areas Planning units - grids of 3900 ha 3014 - current protected areas 1032 - process planning units 2993 Minimum set problem Order - current reserves - riverine/sand corridors - irreplaceable BHUs, plants, vertebrates - large mammals - climatic, upland-lowland gradients - outstanding objectives (minimize vulnerable areas) ----> PLAN requiring 52% of extant habitat
Stage 5 - Implementation Expansion of protected areas in intact habitat Cape Peninsula and Cape Agulhas NP Funds for 3 mega-reserves (> 500,000 ha) and fragmented areas assist conservation of irreplaceable lowlands Promotion of sustainable use of biodiversity investment in ecotourism Promotion of conservation-minded governance adoption of CAPE guidelines in assessing development proposals
Lessons learnt Progress in implementation slow municipal-level decision makers not identified as key stakeholders scale was necessarily coarse- but additional fine scale planning therefore required Limited success at integrating biodiversity issues into land use planning of some sectors municipal level development biodiversity-based enterprises
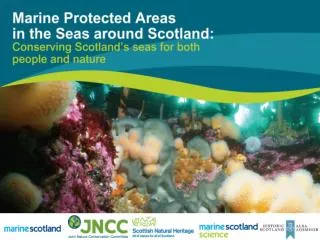
Coral reefs • Incredible biodiversity - 25% of marine spp. • And economically valuable • 8% world lives within 100 km of a reef • 10% of worlds fishing harvest • generate billions of dollars in tourism and provide opportunities for local development Very vulnerable Philippines - 56% reefs close to being lost
Project Seahorse Director Dr Amanda Vincent, Fisheries, UBC “committed to conservation and sustainable use of the world’s coastal marine ecosystems”
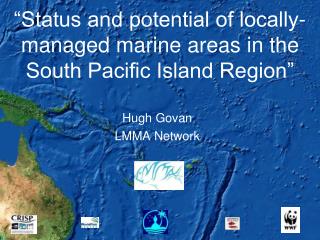
Project Seahorse - Philippines Danajon bank - 145 km one of only six double-barrier reefs in the world
Bohol Island 652 km of coastline 70,000 ha of coral reef 29 coastal municipalities; 1 city of 1.2 million 80,00 full or part-time fishers Fishing is main employer and main supplier of animal protein 1999 - 55% villagers noted use of dynamite and/or poison on fishing areas
Issues Population growth - family size Poverty Overexploitation of marine resource --->Degradation and loss of coral reef Project Seahorse - approach Educate school scholarships/apprenticeships visits to other ‘no-take reserves’ Empower local fishers - KAMADA alliance, Develop alternative employment Research effectiveness of MPAs
Project Seahorse Marine protected areas in Bohol First MPA initiated 1996 Where? How large?
Project Seahorse Community survey one year later vast majority felt reserve was “working” Area expanded to 50 ha Greater focus on enforcement MPA Guardhouse KAMADA member paid by community
Project Seahorse Currently 20 MPAs in northern Bohol KAMADA expanded to 4 islands in Danajon Bank 700+ members 20 independent villages members act as fish wardens play a role in Coastal Law Enforcement provide active link between villages and local and national government MPAs have support of local gov’t as a biodiversity conservation and fisheries management tool
Project Seahorse Science Populaton recovery in no-take zones cf before / after after/control size distributions have changed abundance harvested families up some other families down Spillover effects - evidence of recovery outside MPA ltd BUT - fishers harvest from just outside buffer zones - extraction rate data coming
Lessons learnt Degraded habitat can make good reserves any improvement is easily detected Devolution of power to local governments in 1991 facilitated community empowerment Paired community liaison officer + local biologist teams linked biodiversity and sustainable development Community support generated momentum for further conservation initiatives
Project Seahorse takes volunteers Philipines Deadline May 15 Portugal Deadline April 1 Source for most CFR material - text Ch 14 and Biol Conservation 112 (Vol 1+2)