Download
1 / 27
270 likes | 424 Views
Observations show that the increase of carbon dioxide is fully caused by human activities Pieter P. Tans NOAA Earth System Research Laboratory Boulder, Colorado AGU fall meeting 10 December 2007. DECADAL MASS BALANCE OF CARBON. Fossil fuel data: CDIAC and BP.

E N D
Observations show that the increase of carbon dioxide is fully caused by human activities Pieter P. Tans NOAA Earth System Research Laboratory Boulder, Colorado AGU fall meeting 10 December 2007
DECADAL MASS BALANCE OF CARBON Fossil fuel data: CDIAC and BP
DECADAL MASS BALANCE OF CARBON Pulse response: CO2ATM = 0.131 + 0.201 exp( -t /363) + 0.321 exp( -t /74) + + 0.249 exp ( -t /17) + 0.098 exp( -t /1.9) Hamburg Ocean Carbon Cycle Model, E.Maier-Reimer, 1987
DECADAL MASS BALANCE OF CARBON sources: David Etheridge, CSIRO, Australia; ESRL
DECADAL MASS BALANCE OF CARBON GtC Cumulative fossil fuel emissions (Jan. 2007) 331 ± 25 (source: CDIAC) Observed atmospheric increase (Jan. 2007) 214 ± 8 (source: ESRL) Observed ocean increase through 1994 118 ± 19 (Sabine et al., Science 2004) oceans, extrapolated through 2006 148 fossil fuel emissions + terrestrial sources = atmospheric increase + ocean
DECADAL MASS BALANCE OF CARBON Hamburg Ocean Carbon Cycle Model, E. Maier-Reimer, 1987 fossil fuel emissions + terrestrial sources = atmospheric increase + ocean
DECADAL MASS BALANCE OF CARBON Princeton Ocean Carbon Cycle Model, J. Sarmiento, 1992 fossil fuel emissions + terrestrial sources = atmospheric increase + ocean
DECADAL MASS BALANCE OF CARBON Bern Model (HILDA), F. Joos, 2005 fossil fuel emissions + terrestrial sources = atmospheric increase + ocean
DECADAL MASS BALANCE OF CARBON Conclusions: The observed increase in atmospheric carbon dioxide since pre-industrial times is entirely due to human activities. The measured increases in the atmosphere and oceans add up to the cumulative fossil fuel emissions. The relative contribution of NET changes in terrestrial biomass and organic matter has dwindled over time and is now relatively small.
ISOTOPIC RATIO SIGNATURES Use of isotopic ratios to distinguish sources 13C/12Csample– 13C/12Creference 13C/12Creference 14C/Csample δ13C 13C/12C ratio 14C/Creference (approximate) (approximate) Atmosphere -8 ‰ 0.011147 1.06 From oceans -8 ‰ 0.011147 1.08 Terrestrial biosphere -26 ‰ 0.010945 1.10 Coal -24 ‰ 0.010967 0 Oil -28 ‰ 0.010923 0 Natural gas -45 ‰ 0.010732 0
ISOTOPIC RATIO SIGNATURES Sources: Friedli (1986), Francey (1999 ), and ESRL & INSTAAR
RECENT RATES OF CHANGE more uptake
RECENT RATES OF CHANGE carbon budgets 5-year averaged, centered on 2000 (Gton C/year) 5-year averaged, centered on 2005 (Gton C/year) fossil emissions 7.0 8.1 atmos. increase 4.0 4.4 total uptake, 3.0 3.7 of which: oceans 2.9 3.2 terrestrial 0.1 0.5
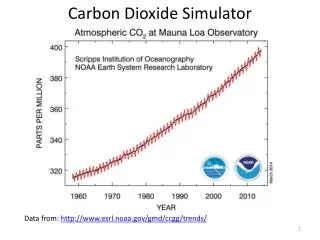
CO2 GROWTHRATE and CLIMATE ANOMALIES www.esrl.noaa.gov/gmd/ccgg/trends/
CO2 GROWTHRATE and CLIMATE ANOMALIES Conclusion: 2/3 of the interannual variance of the CO2 growth rate is explained by the delayed response of the terrestrial biosphere to interannual variations of temperature and precipitation.


![Human carbon dioxide emissions [ Mt C]](https://cdn3.slideserve.com/5454257/slide1-dt.jpg)