Download
1 / 16
160 likes | 394 Views
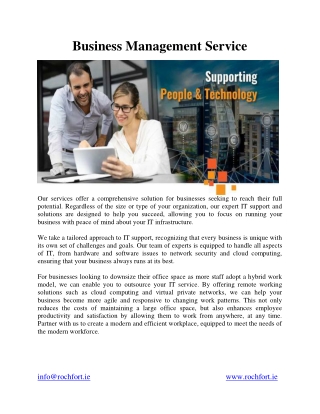
Business Service Management. Tivoli Business Service Manager Relationships & KPIs. Tivoli Netcool/Impact Correlation and Context. Provides business & operational dashboards, service modeling, impact & root cause analysis, and tracking of key performance indicator (KPIs) & SLAs.

E N D
Tivoli Business Service Manager Relationships & KPIs Tivoli Netcool/Impact Correlation and Context • Provides business & operational dashboards, service modeling, impact & root cause analysis, and tracking of key performance indicator (KPIs) & SLAs. • Enriches events with business context, provides integrated view of data from multiple sources in context, enables custom automations Business Service Management Impact TBSM Omnibus What Matters Most! TADDM IT Tivoli Business Service Management – from services to resources Tivoli Application Dependency Discovery Application Discovery and Configuration Mgmt Tivoli Netcool/OMNIbus: Event Collection & Status • Collects and consolidates event & performance threshold information from hundreds of IBM and 3rd party monitoring & event management tools to feed TBSM. • Collects and maps discovered IT components to applications. Discovers configuration changes and provides analytics for change and baseline comparisons
Where can Impact help with Automation Workflow Event/Incident/ Problem Integrated Views Correlate Runtime Enrich Interactive Right- click Intelligence 3 1 2 Allows operators to trigger automated actions directly from a virtual view. Collects & injects vital details directly into events, incidents & problems for better context. Collects & displays information from multiple data sources & tools in single view. Allows for right-click triggering of automated workflow actions from any tool. Automatically runs workflow actions without the need for manual intervention. Allows for advanced, custom correlation based on unique criteria. Speeds mean-time-to-resolution. Improves decision-making and staff effectiveness. Maximizes operational staff productivity. Operational Function Netcool/Impact Automations Function Benefit
Business Service Dashboard: Integrated Visibility & Context • Service Models • Common Tooling • Visualization • Navigation • Single Sign-On • Automation • Data warehouse • Real-time & Historical Reporting • Out of the box reports • Costs • Time series • SLAs • In-context launch from dashboard Drag & Drop Layout Charts & Graphs Realtime & Historical Business & Service KPIs
Business Service Dashboard SLA Indicators Risk & Compliance Key Performance Indicators Usage & Financial Business Service Dashboards: Integrated Visibility & Context Measuring & Improving Delivery Against Objectives: • Key Performance Indicators: • E.g. Transactions, Revenue, MTTR, Call Volume • SLA Indicators: • E.g. Customer Experience, Service Uptime, Transaction Rate, Infrastructure • Risk & Compliance Indicators: • E.g. Cobit, ISO, SOX, Basel II • Usage & Financial Indicators: • E.g. Service usage by LOB, Power by Service, IT cost per service Applications / Databases Monitoring / CMDB Inventory / Asset Service Desk
Launch in context to configuration details panels Cross tier application maps Configuration changes • Breadth of discovery: • Transactions • Distributed & Mainframe • SOA & Virtualization • Storage • Network • Security • Topology Mapping: • Periodic • Partial/Full • Manual • Configuration Details & Change History TADDM - Context: Automated Service Mapping & Change Audits • Automated Impact & Root Cause Analysis • Services, Processes, Transactions • Predictive Impact & Root Cause • Physical & Logical Dependencies • Real-time Dependency Mapping: • Discovery tools • CMDBs • BPEL • Asset/Inventory • Enriched Events
Smart Planet - Energy Performance Management Visibility and Control over energy costs in IT and Facilities infrastructure Identify Underutilized Assets Optimize Storage Energy Use Optimize Assets for Energy Usage Energy Efficient Business Service Management Tivoli Monitoring for Energy Management Provisioning, Automation and Scheduling Financial Accounting for Energy
Elements of a common energy dashboard • Common Energy Dashboard (TBSM) • Executive • Operational TBSM Geographic Dashboard (optional) Thermal Visualization (MEO) Real-time Monitoring and Alerts (ITMfEM) View Asset Details (Maximo) Energy Reports (ITMfEM) Incident and Maintenance Change Details (SRM) Energy Financial Reports (TUAM) Building Management Systems
Tivoli Wikis and Documentation Central Tivoli SAPM Outside-in Design/IDD October 2009
Tivoli Documentation Central Improves Time-to-Value • Launched Tivoli Documentation Central wiki August 3 • Centralized location for all Tivoli documentation • Solution links directly to Information Centers • Welcome page provides links to current and prior versions, wikis, Redbooks and Support (including Technotes) • No configuration requirements. Accessed from ibm.com • Go to Products Software Tivoli Tivoli Documentation Central
Summary • Broadest and Deepest Service Management Portfolio • Integration focus delivering results for Customers • Going forward • Integration focus • Deliver best of breed SME offerings • Focus on Visualization and Analytics • Client Satisfaction • Drive down TCO • Information Collaboration • Quality Programs
THANK YOU! 16