Download
1 / 21
230 likes | 389 Views
DECOMPOSING DIFFERENCES IN TOTAL FACTOR PRODUCTIVITY ACROSS FIRM SIZE. Laia Castany, Enrique López-Bazo, Rosina Moreno COINVEST Conference Intangible Investments at Macro and Micro Levels and Their Role in Innovation, Competitiveness and Growth Lisbon, 18th-19th March 2010. 1. Motivation.

E N D
DECOMPOSING DIFFERENCES IN TOTAL FACTOR PRODUCTIVITY ACROSS FIRM SIZE Laia Castany, Enrique López-Bazo, Rosina Moreno COINVEST Conference Intangible Investments at Macro and Micro Levels and Their Role in Innovation, Competitiveness and Growth Lisbon, 18th-19th March 2010
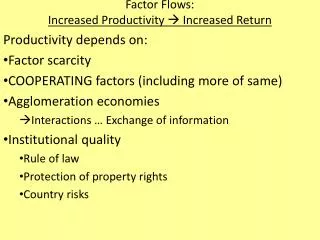
1. Motivation • Productivity is an issue of major concern. In the last years, the productivity growth has slowed down in many advanced economies. [O'Mahoney & van Ark, 2003] • The Spanish economy has also suffered a deceleration process since the mid nineties [Gual et al., 2006; Segura et al, 2006]. • Spain should increase its competitiveness through efficiency to guarantee sustained growth higher investment in technological and human K (Intangible Assets) is required [National Reform Program for Spain in the Lisbon Agenda] • Large firms are more productive [Bartelsman and Doms, 2000; Ruano, 2002] • Limitation Spain: predominance of SMEs (Large: 0.1% in Spain vs. 0.2% in EU-15; 20% vs. 35% of employment)
1. Motivation • This study contributes to the empirical evidence that the innovative activity and the use of skilled labor foster firms’ productivity. • Firm size is an important source of heterogeneity in productivity across firms. • Explores differences in Total Factor Productivity across firm size (TFP-size gap) for the Spanish manufacturing sector between 1990-2002. Assessing the contribution of INN & HK (Intangible Assets) in the TFP-size gap: Differences in characteristics and returns.
ROADMAP • Motivation • Theoretical background • Empirical specification • Dataset • Descriptive analysis • Estimation • Decomposing the TFP-size gap • Conclusions
2. Theoretical background 2.1. Heterogeneity at microeconomic level: • Empirical evidence on heterogeneity (in productivity, technology, entry-exit patterns, etc.) across firms with similar characteristics. • Size as a source of heterogeneity in productivity: large firms are systematically found to be more productive [Bartelsman & Doms, 2000]. • Large firms have advantages: • Scale economies effect, scope economies effect, experience effect or organization effect [Audretsch et al., 1998)]. • At different production levels some technologies would be more appropriate than others. • Industry effect. • Small firms are “engines of growth” (importance for the economy as a whole) [Schumpeter; Audretsch, 2002]: • Employment creators. • Innovators. • Entrepreneurship character. • Initiators, catalysts and media for wider technical change.
2. Theoretical background 2.2. Direct and Indirect effect of size (Geroski, 1998): • Direct effect: Size, as a variable that ceteris paribus improves efficiency. size as a regressor, TFP=f(size, …) • Indirect effect: Size, conditioning the effect of other variables on productivity. different coefficients of INN and HK for S&L firms are allowed. TFPsize=f(HKsize, INNsize, …) • Intuition: Does a large firm get higher returns from an additional investment in HK? Large more productive. • Small & large firms show different patterns of behaviour
2. Theoretical background 2.3. The relation between knowledge capital, TFP and size:
2. Theoretical background 2.3. The relation between knowledge capital, TFP and size:
2. Theoretical background Two reasons for higher productivity in large firms: (1) higher investment in INN and HK (Intangible Assets) (2) higher returns from these investments an additional INN or skilled worker in a large firm could result in higher returns Assessing the contribution of INN & HK in the TFP-size gap: Differences in characteristics and returns.
3. Empirical specification where: - TFP is the total factor productivity index in firm i in year t - INN is a dummy variable that equals 1 when the firm has innovated (process) (*) - HK is the % of qualified workers (*) - X (controls): SIZEis the number of workers AGE is the number years since the constitution IND is a set of 20 industrial dummies YEAR is a time dummy - μFirm-specific effect (random effects) (*) Possible endogeneity between TFP and INN & KH lagged 1 period Robustness analysis including: structure of ownership, market competition, economic cycle and regions.
3. Empirical specification TFP Index: Good, Nadiri and Sickles (1996) • where: • Y = output; X = inputs L, K, M; S = cost-based share of inputs; • subscripts i, t refer to firm and time period and the bar over the variables denotes their arithmetic mean. • Permits avoiding problems of endogeneity related to the estimation of the input shares • It accounts for technological change (lower part of the expression = cumulative change in Y,X in the reference firms from the initial year to year t ). • Transitive • Superlative • It accounts for market power • Input shares are specific of every firm
4. Dataset: Encuesta sobre Estrategias Empresariales (ESEE) • ESEE = “Survey on Business Strategies” • - Annual survey, widely used studies on industrial organization in Spain. • Unbalanced panel between 1990 and 2002. - Reference population: manufacturing firms with 10 or more employees. - Representative by size and industry. - Small firms 10-200 employees; Large >200. - Cleaning procedure: observations with incomplete data and anomalous observations according to some criteria (following Ornaghi, 2006). - After this: 13000 observations for 2100 firms, around 800-1000 observations per year TFP index. - Periods of analysis: 1994 (852 firms); 1998 (968 firms); 2002 (864 firms)
5. Descriptive Analysis • Confirm previous empirical evidence: - TFP increases almost every year: 1.6% annual • Slowdown in the 2nd half of 90’ (from 2.3% to 0.8%) • Large firms are significantly more productive on every year TFP-size gap. • Differences/gap reduce, as TFP in small firms grew faster in the 2nd half of 90s.
5. Descriptive Analysis • TFP & INNOVATION • Process innovations (binary variable), but similar results using R&D expenditure. • Confirm previous empirical evidence pointing that: • L innovate more (50% vs. 30%) statistically significant differences. • Innovative (INN) firms are significantly more productive. • INN contributes to reduce the TFP-size gap key element for small firms to achieve higher TFP levels. • INN makes a difference in TFP levels for S, but not for L relationship between TFP-INN is conditioned by SIZE.
5. Descriptive Analysis • TFP & HUMAN CAPITAL • Education (% of skilled workers). • Confirm previous empirical evidence pointing that: • L use more HK (12% vs. 8%) statistically significant differences • Firms that use more HK are significantly more productive. • L are significantly more productive regardless of HK HK does not seem to help small firms reducing the gap a possible explanation: L obtain higher returns from HK • The causality relationship between INN & HK – TFP might be questioned; Also, we are not taking into account other factors explaining the gap; further evidence in what follows.
6. Estimation • INN & HK TFP • large firms have a greater incentive to use KH & INN • slightly smaller coefficients for RE model • sensitivity analysis: including additional vbles size effect disappears, but INN & HK remain
7. Decomposing the TFP-size gap The Oaxaca-Blinder decomposition • Studying the contribution of INN & HK in explaining the differential in TFP between S&L firms (analysis in the mean of the distribution). • Oaxaca-Blinder methodology decomposes the contribution of each variable as: - Differences in characteristics - Differences in returns • Departs from two auxiliary regressions for the subsample of S&L firms • Decomposes the TFP differential in two components (Oaxaca and Ransom, 1994): where: X is the vector of firm endowments, β = returns
7. Decomposing the TFP-size gap • As a whole: firm’s characteristics explain almost completely the TFP differential
7. Decomposing the TFP-size gap • As a whole: firm’s characteristics explain almost completely the TFP differential • INN & HK: explain quite an important part of the differential • INN, modest contribution (10%, characteristics) • HK, larger contribution (16-36%, endowment 1/3 + returns 2/3) & increasing • Similar results for decomposition based on RE estimation although smaller contribution of INN & HK
8. Conclusions • Large firms are more productive TFP-size gap • Investment in intangible assets contributes to increase firms’ productivity. • Differences in HK & INN together explain quite a large part of the TFP-size gap. • Increasing the levels of INN in small firms could improve their TFP • But: an effort to increase HK requires higher returns to HK in small firms so that TFP increases (small firms have less incentives to use HK) • National Reform Program (Spain should increase its human capital levels) Increasing skilled workers in SMEs would only have a positive impact on productivity if returns increased Otherwise the effort would have a limited impact (in SMEs & total economy).
DECOMPOSING DIFFERENCES IN TOTAL FACTOR PRODUCTIVITY ACROSS FIRM SIZE Laia Castany, Enrique López-Bazo, Rosina Moreno COINVEST Conference Intangible Investments at Macro and Micro Levels and Their Role in Innovation, Competitiveness and Growth Lisbon, 18th-19th March 2010